echart文档
echart生态圈
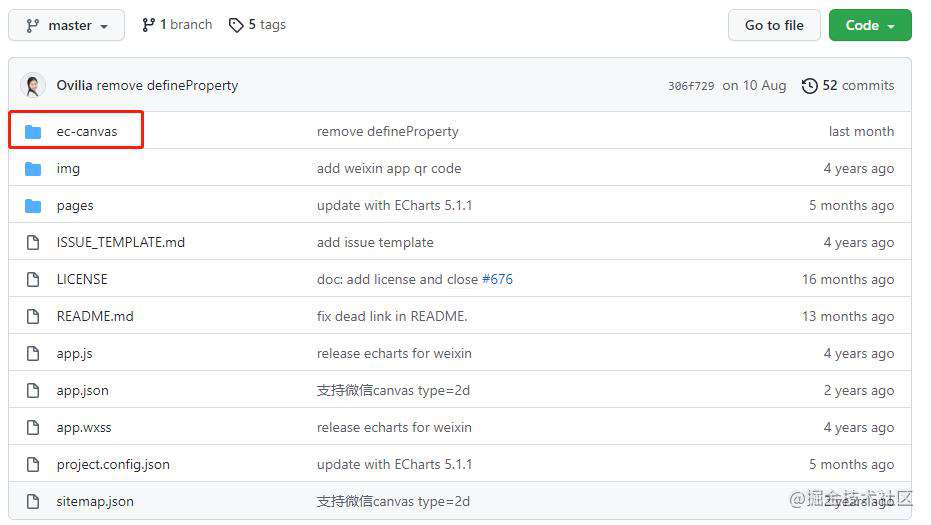
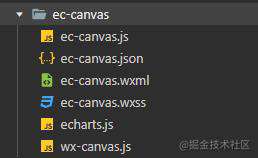
1、在echart官网中下载ec-canvas文件放到项目中


2、用法
1、json 中引入echarts 组件
{
  "usingComponents": {
    "ec-canvas":"../../ec-canvas/ec-canvas"
  }
}
2、在js中引入echarts库
import * as echarts from '../../ec-canvas/echarts';
let noData = {
  text: '暂无数据~',
  x: 'center',
  y: 'center',
  textStyle: {
    color: '#fff',
    fontWeight: 'normal',
    fontSize: 14
  }
}
const locationOption = function (yLabel, yData) {
  var option = {
    title: yData.length > 0 ? '' : noData,
    grid: {
      left: '5%',
      right: '5%',
      bottom: '0%',
      top: '0%',
      containLabel: true
    },
    tooltip: {
      show: false,
    },
    backgroundColor: '#031d33',
    xAxis: {
      show: false,
      type: 'value',
    },
    yAxis: [{
      type: 'category',
      inverse: true,
      axisLabel: {
        show: true,
        textStyle: {
          color: '#fff',
          fontSize: '14',
          fontWeight: 400
        },
      },
      splitLine: {
        show: false
      },
      axisTick: {
        show: false
      },
      axisLine: {
        show: false
      },
      data: yLabel
    }, {
      type: 'category',
      inverse: true,
      axisTick: 'none',
      axisLine: 'none',
      show: true,
      axisLabel: {
        textStyle: {
          color: '#fff',
          fontSize: '14',
          fontWeight: 400
        },
      },
      data: yData
    }],
    series: [{
      name: '各镇街作业场所',
      type: 'bar',
      z: 1,
      itemStyle: {
        normal: {
          barBorderRadius: [0, 30, 30, 0],
          color: new echarts.graphic.LinearGradient(0, 0, 1, 0, [{
            offset: 0,
            color: 'rgba(48, 236, 166, 0.5)'
          }, {
            offset: 1,
            color: 'rgba(48, 236, 166, 1)'
          }]),
          shadowBlur: 0,
          shadowColor: 'rgba(48, 236, 166, 1)'
        },
      },
      barWidth: 10,
      data: yData
    }
    ]
  };
  return option;
}
Page({

  /**
   * 页面的初始数据
   */
  data: {
    echart: {
      lazyLoad: true
    }
  },

  /**
   * 生命周期函数--监听页面加载
   */
  onLoad: function (options) {
    let arr = [
      { valueName: "勒流", intValue: 7, stringValue: null },
      { valueName: "陈村", intValue: 12, stringValue: null },
      { valueName: "北滘", intValue: 34, stringValue: null },
      { valueName: "乐从", intValue: 45, stringValue: null },
      { valueName: "龙江", intValue: 55, stringValue: null },
      { valueName: "均安", intValue: 68, stringValue: null },
      { valueName: "伦教", intValue: 78, stringValue: null },
      { valueName: "杏坛", intValue: 85, stringValue: null },
      { valueName: "容桂", intValue: 90, stringValue: null },
      { valueName: "大良", intValue: 120, stringValue: null },
    ]
    this.initWorkLocationChart(arr);
  },
  //!初始化echart
  initChart (id, option, chart) {
    return new Promise((resolve, reject) => {
      let lessonChartComponnet = this.selectComponent(id);
      if (!chart) {
        lessonChartComponnet.init((canvas, width, height, dpr) => {
          chart = echarts.init(canvas, null, {
            width: width,
            height: height,
            devicePixelRatio: dpr
          });
          chart.clear();
          chart.setOption(option);
          resolve(chart);
          // return chart;
        });
      } else {
        chart.clear();
        chart.setOption(option, true);
        resolve(chart);
        // return chart;
      }
    });
  },
  initWorkLocationChart (data) {
    data.sort(this.sortData)
    let yLabel = [], yData = [];
    data.map(item => {
      yLabel.push(item.valueName);
      yData.push(item.intValue);
    });
    this.initChart("#echart", locationOption(yLabel, yData)).then(res => {
      console.log("res", res);
    });
  },
})
3、wxml
<view class="echartBg" style="width:750rpx;height:50vh">
  <ec-canvas id="echart" canvas-id="echart" ec="{{ echart }}"></ec-canvas>
</view>
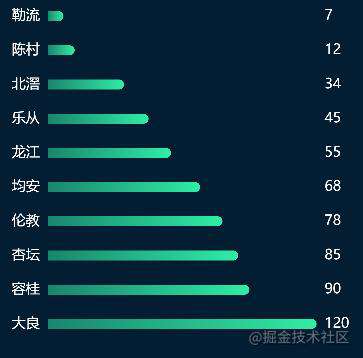
3、效果


常见问题FAQ
- 免费下载或者VIP会员专享资源能否直接商用?
- 本站所有资源版权均属于原作者所有,这里所提供资源均只能用于参考学习用,请勿直接商用。若由于商用引起版权纠纷,一切责任均由使用者承担。更多说明请参考 VIP介绍。
- 提示下载完但解压或打开不了?
- 找不到素材资源介绍文章里的示例图片?
- 模板不会安装或需要功能定制以及二次开发?


发表评论
还没有评论,快来抢沙发吧!