1.多坐标轴
1.1简单多坐标轴
效果:
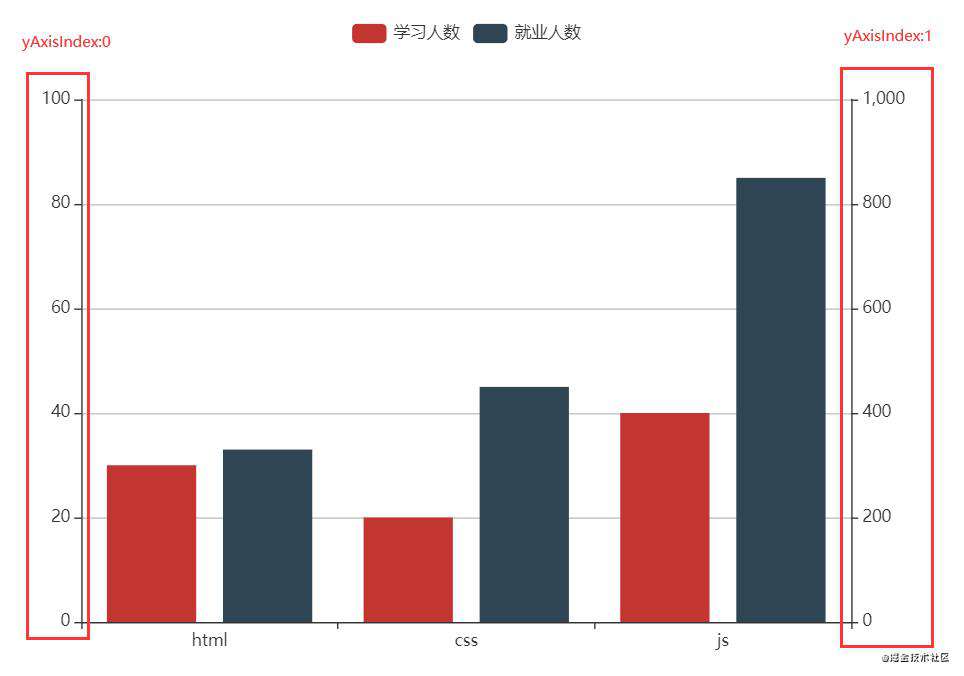
const option = {
    /*图例*/
    legend:{data:['学习人数','就业人数']},
    /*提示*/
    tooltip:{},
    /*x 轴*/
    xAxis:{
        data:['html','css','js']
    },

    /*y 轴
    *   yAxis设置为数组,数组中的每个元素存储每个轴的配置
    *   name 坐标轴名称
    *   min 刻度最小值
    *   max 刻度最大值
    * */
    yAxis:[
        {max:100},
        {}
    ],

    /*系列列表 series
    *   yAxisIndex 当前系列对应的y 轴的索引位置
    * */
    series:[
        {
            name:'学习人数',
            type:'bar',
            data:[30,20,40],
            yAxisIndex:0
        },
        {
            name:'就业人数',
            type:'bar',
            data:[330,450,850],
            yAxisIndex:1
        }
    ]
};
1.2复杂多坐标轴
效果:
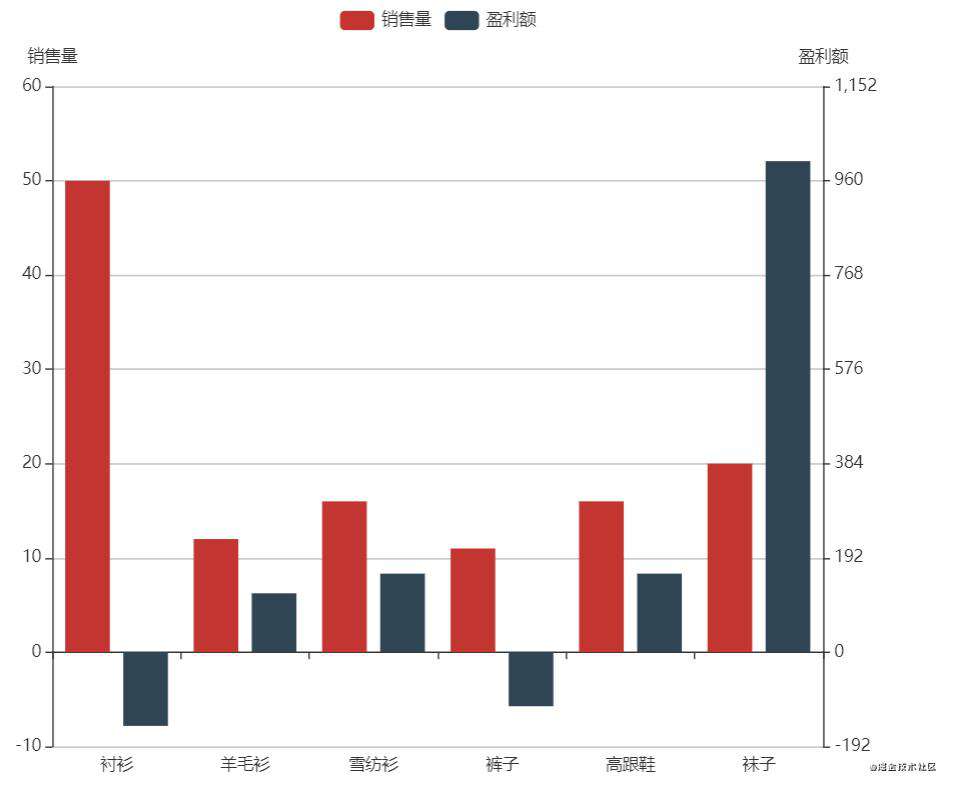
主要需要做的事设置每个y轴的min,max和interval值,如下
/*
* data1 销售量的系列数据
* data2 盈利额的系列数据
*/
const data1=[50, 12, 16, 11, 16, 20];
const data2=[-150, 120, 160, -110, 160, 1000];

//理想行数(实际行数会有浮动)
let rowNum=6;

/*数据极值
*   max1 销售量数据的最大值
*   max2 盈利额数据的最大值
*   min1 销售量数据的最小值
*   min2 盈利额数据的最小值
* */
let max1=Math.max(...data1);
let max2=Math.max(...data2);
let min1=Math.min(...data1);
let min2=Math.min(...data2);

/*极值比例*/
const rat1=min1/max1;
const rat2=min2/max2;

/*比例大小对比*/
const ratState=rat1>rat2;
/*设置极小值
*   如果系列1的最小比最大大于系列2的最小比最大,让系列1的极小值等于自身的极大值乘以系列2的极值比例
*   否则,让系列2的极小值等于自身的极大值乘以系列1的极值比例。
*   因为行数必须相同!
*  */
if(ratState){
    min1=rat2*max1;
}else{
    min2=rat1*max2;
}

/*
* inter1 销售量的行高取整
* inter2 盈利额的行高取整
* */
let inter1=Math.ceil((max1-min1)/rowNum);
let inter2=Math.ceil((max2-min2)/rowNum);
console.log(inter1,inter2);

/*对极值微调*/
min1=Math.floor(min1/inter1)*inter1;
max1=Math.ceil(max1/inter1)*inter1;
min2=Math.floor(min2/inter2)*inter2;
max2=Math.ceil(max2/inter2)*inter2;

//法一
/*求行数*/
const maxRowNum=Math.max(max1/inter1,max2/inter2);
const minRowNum=Math.min(min1/inter1,min2/inter2);

/*极值微调*/
min1=inter1*minRowNum;
max1=inter1*maxRowNum;
min2=inter2*minRowNum;
max2=inter2*maxRowNum;

//法二
const rowNum1 = (max1-min1)/inter1;
const rowNum2 = (max2-min2)/inter2;
rowNum = Math.max(rowNum1,rowNum2);

if(rowNum!=rowNum1){
    //调整1
    max1 = rowNum1*inter1;
}else if(rowNum!=rowNum2){
    //调整2
    max2 = rowNum2*inter2;
}
然后分别将min1,max1,inter1,min2,max2,inter2的值赋给两个y轴即可
2.异步数据
效果:
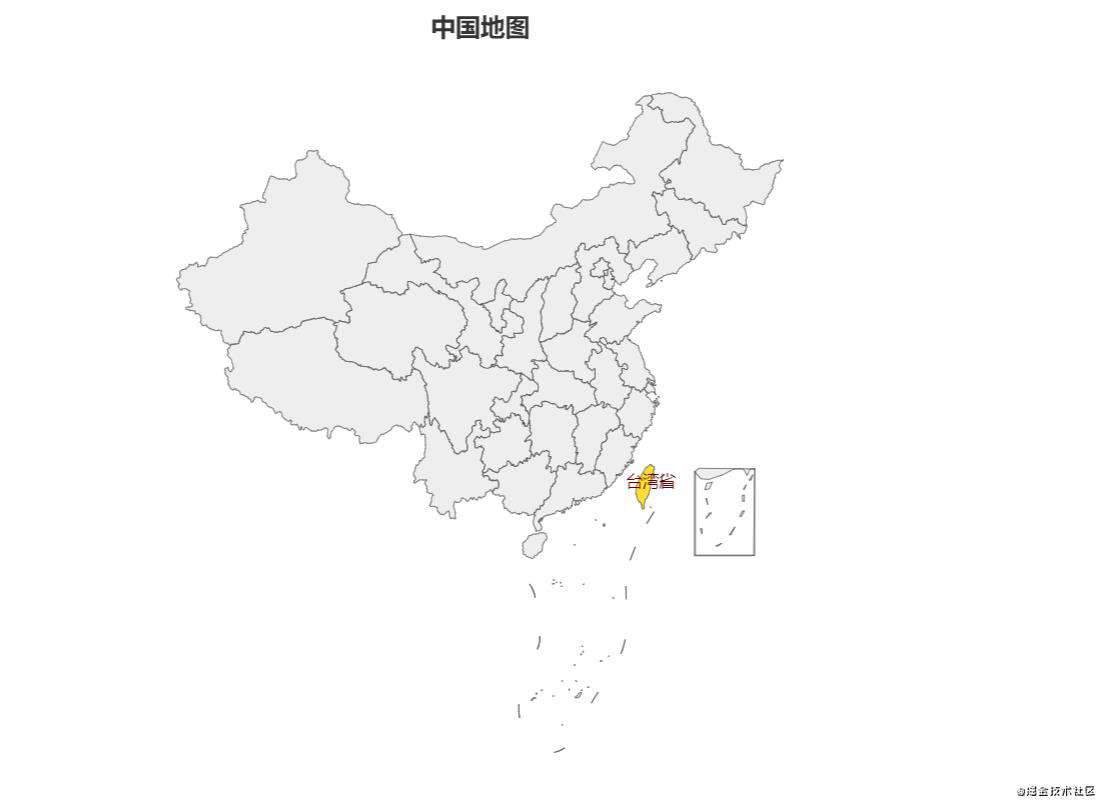
2.1 请求到数据后setOption
const myChart = echarts.init(document.getElementById('main'));
fetch('./data/China.json')
    .then((res) => res.json())
    .then(data => {
        /*注册地图*/
        echarts.registerMap('china', data);
        /*配置项*/
        const option = {
            title: {
                text: '中国地图',
                left:'center'
            },
            series: {
                type: 'map',
                map: 'china'
            }
        };
        /*基于配置项显示图表*/
        myChart.setOption(option);
    })
2.2 先setOption有什么先配置什么,请求到数据后追加option
const myChart = echarts.init(document.getElementById('main'));
/*有什么先配置什么*/
myChart.setOption({
    title: {
        text: '中国地图',
        left:'center'
    }
});
myChart.showLoading()
fetch('./data/China.json')
    .then((res) => res.json())
    .then(data => {
        myChart.hideLoading()
        /*注册地图*/
        echarts.registerMap('china', data);
        /*等请求到数据后,追加配置*/
        myChart.setOption({
            series: {
                type:'map',
                map:'china',
            }
        });
    })
3.数据集
3.1 简单使用
效果:
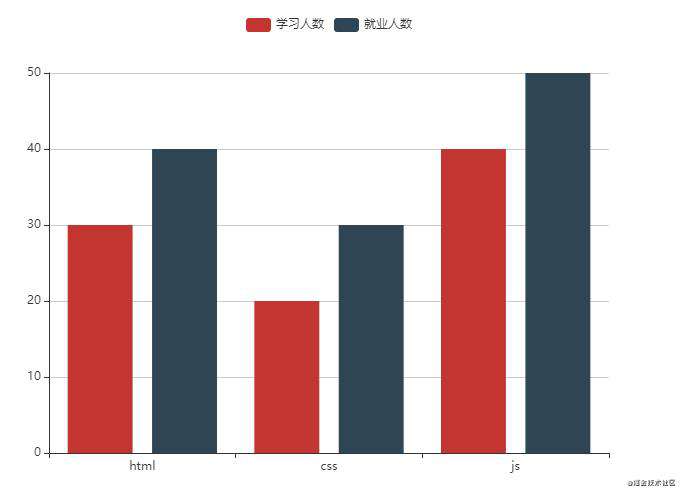
//基于准备好的dom,初始化echarts实例
const myChart = echarts.init(document.getElementById('main'));
//数据源
const source=[
    ['大前端','学习人数','就业人数'],
    ['html',  30,       40],
    ['css',   20,       30],
    ['js',  40,       50],
]
/*const source=[
    {'大前端':'html','学习人数':30,'就业人数':40},
    {'大前端':'css','学习人数':20,'就业人数':30},
    {'大前端':'js','学习人数':40,'就业人数':50},
]*/

// 指定图表的配置项和数据
const option = {
    /*图例*/
    legend:{},
    /*
    * dataset数据集
    *   source 数据源 []
    * */
    dataset:{source},

    /*x轴
    *   type 轴的类型
    *       category 类目轴,离散型数据
    *       value 数值轴,连续性数据
    * */
    xAxis:{
        type:'category',
        // data:['html','css','js']
    },
    yAxis:{
        type:'value'
    },
    /*系列列表*/
    series:[
        {
            // name:'学习人数',
            type:'bar',
            // data:[30,20,40]
        },
        {
            type:'bar'
        },
    ]

};

// 使用刚指定的配置项和数据显示图表。
myChart.setOption(option);
3.2行列映射
效果:
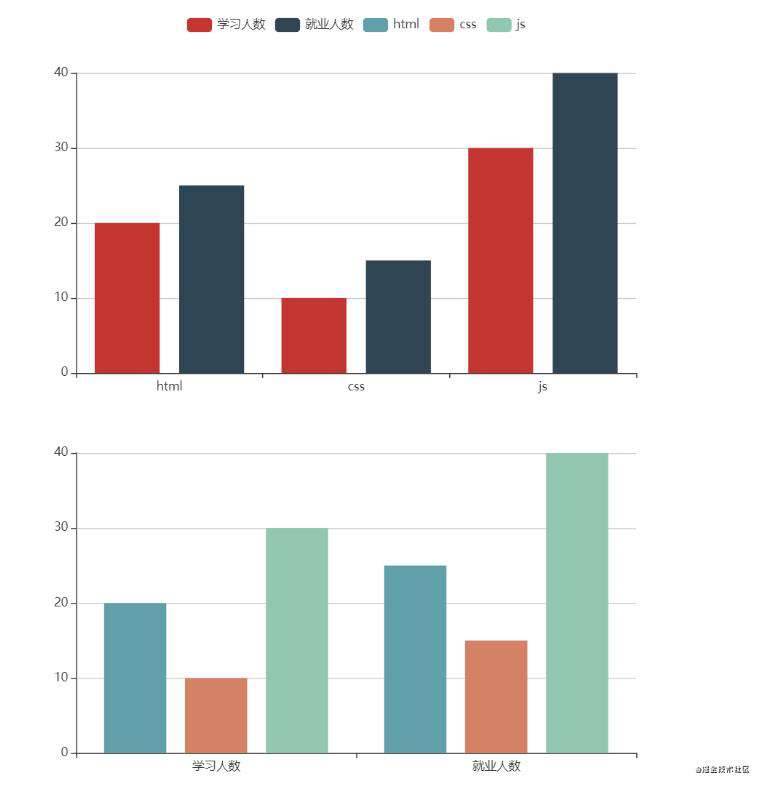
//数据源
const source=[
    ['大前端','学习人数', '就业人数'],
    ['html',  20,   25],
    ['css',   10,   15],
    ['js',    30,   40]
];

// 指定图表的配置项和数据
const option = {
    legend: {},
    tooltip: {},

    /*
    * dataset数据集
    *   source 数据源 []
    *   seriesLayoutBy 行列映射
    *       column 基于列映射
    *       row 基于行映射
    * */
    dataset: {
        source,
    },

    /*grid [{},{}] 在一个echarts 实例中建立多个grid,并设置其位置
    *   bottom 下边距,如'55%'
    *   top 上边距,如'55%'
    * */
    grid:[
        {bottom:'55%'},
        {top:'55%'}
    ],


    /*建立两个x 轴,分属两个网格
    *   type 轴类型,如category
    *   gridIndex 绘图区索引位置
    * */
    xAxis: [
        {type: 'category',gridIndex:0},
        {type: 'category',gridIndex:1}
    ],
    /*建立两个y 轴,分属两个网格*/
    yAxis:[
        {type:'value',gridIndex:0},
        {type:'value',gridIndex:1}
    ],
    /*
    * series系列
    *   type 图表类型
    *   seriesLayoutBy 行列映射
    *       column 列映射,默认
    *       row  行映射
    *   xAxisIndex x轴索引
    *   yAxisIndex y轴索引
    * */
    series: [
        {type: 'bar'},
        {type: 'bar'},
        {
            type: 'bar',
            xAxisIndex:1,
            yAxisIndex:1,
            seriesLayoutBy:'row'
        },
        {
            type: 'bar',
            xAxisIndex:1,
            yAxisIndex:1,
            seriesLayoutBy:'row'
        },
        {
            type: 'bar',
            xAxisIndex:1,
            yAxisIndex:1,
            seriesLayoutBy:'row'
        },
    ]
};
3.3维度映射
效果:
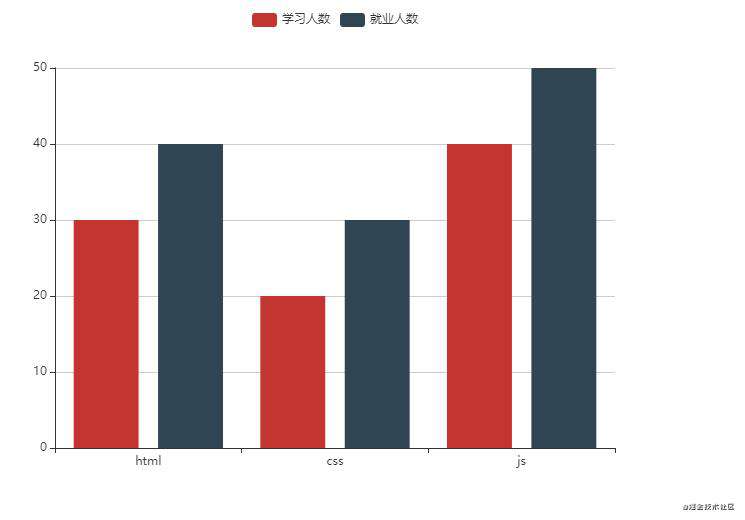
//数据源
const source=[
    ['html',  20,   25],
    ['css',   10,   15],
    ['js',    30,   40]
];

//维度映射 dimensions
const dimensions=[null,{name:'学习人数'}, '就业人数'];

// 指定图表的配置项和数据
const option = {
    legend: {},
    tooltip: {},
    dataset: {source,dimensions},
    xAxis: {type: 'category'},
    yAxis: {},
    series: [
        {
            // name:'上课人数',
            type: 'bar',
        },
        {
            type: 'bar',
        },
    ]
};
3.4编码映射
数据如下,如果只想展示就业人数,可以采用编码映射
效果:
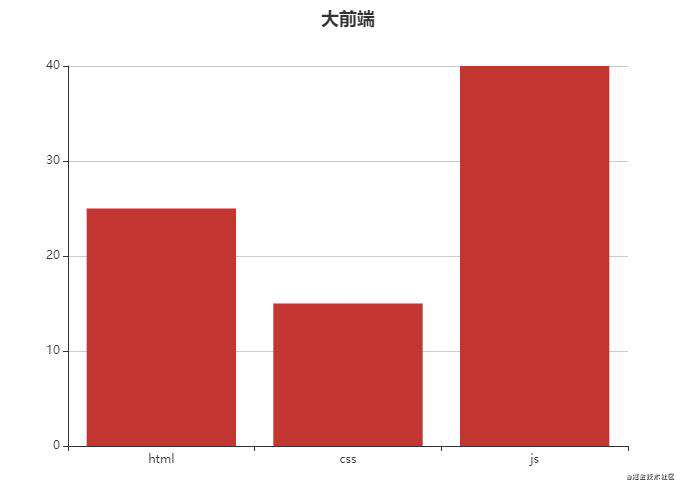
//维度映射
const dimensions=['大前端','学习人数', '就业人数'];
//数据源
const source =[
    ['html',  20,   25],
    ['css',   10,   15],
    ['js',    30,   40],
];
// 指定图表的配置项和数据
const option = {
    title:{
      text:  dimensions[0],
      left:'center'
    },
    legend:{},
    tooltip:{},
    dataset: {dimensions,source},
    /*设置类目轴和数值轴*/
    xAxis:{type:'category'},
    yAxis:{type:'value'},
    /*encode 编码映射
    *   x x轴维度
    *   y y轴维度
    *   seriesName 系列名,n|[n]|[n,m,...]
    *   tooltip 提示信息,n|[n]|[n,m,...]
    * */
    series:{
        type:'bar',
        encode:{
            // seriesName:2,
            // x:0,
            x:'大前端',
            // y:2,
            y:'就业人数',
            tooltip:[1,2]
        }
    }
};
3.5编码扩展映射
效果:
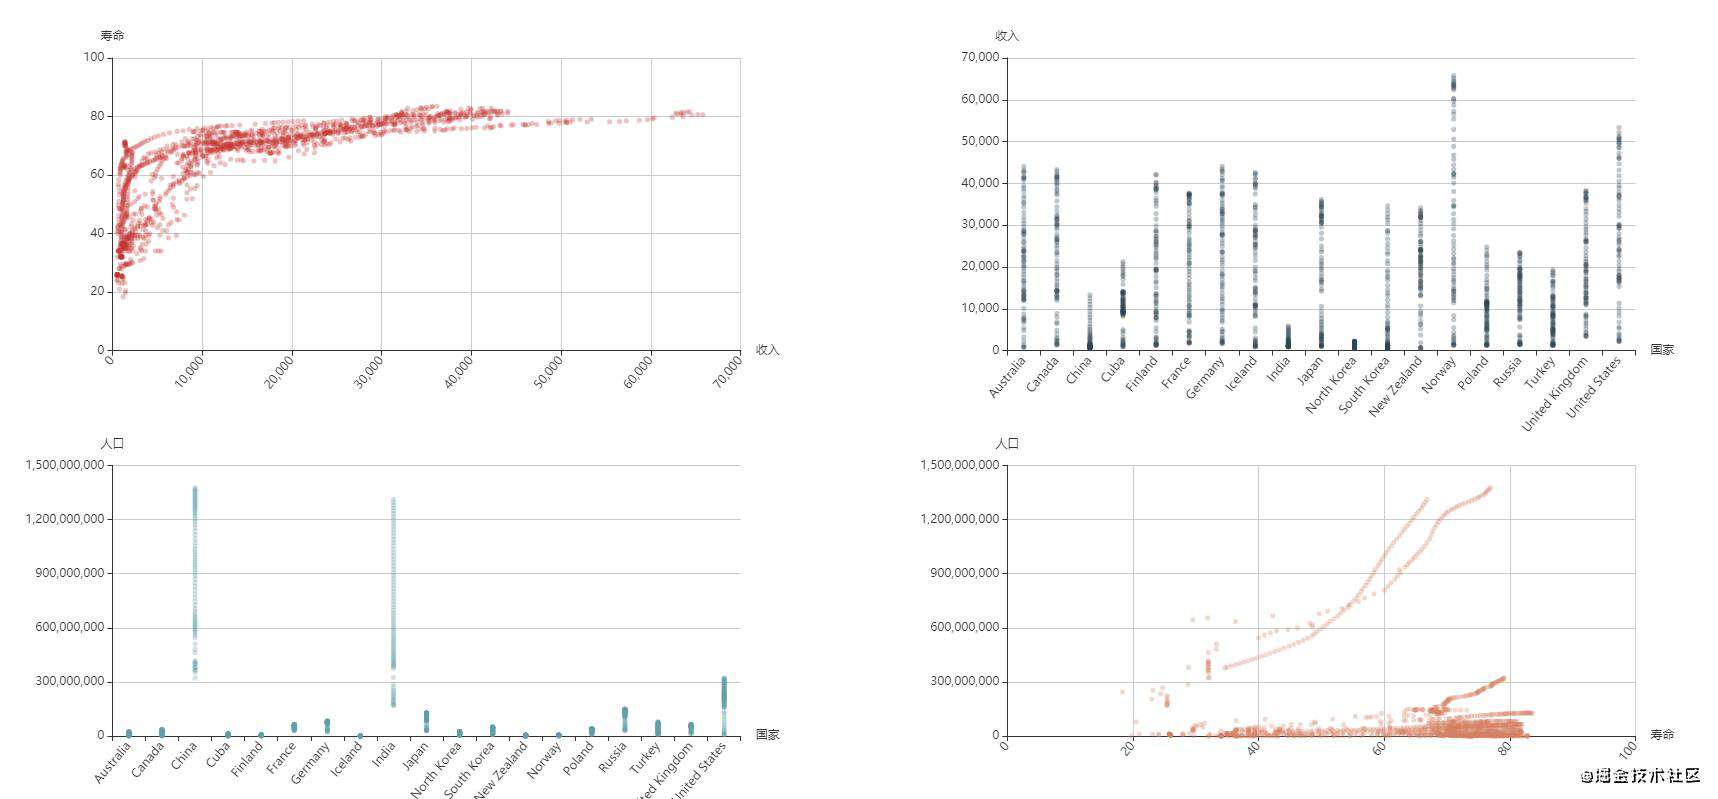
//配置项
let option=null;
//异步请求数据
fetch('./lib/table.json')
    .then((res) => res.json())
    .then(data => {
        //显示数据
        show(data);
    });

function show(data){
    let sizeValue = '57%';
    let symbolSize = 5;
    option = {
        //提示
        tooltip:{},
        /*建立四个绘图区*/
        grid: [
            {right: sizeValue, bottom: sizeValue},
            {left: sizeValue, bottom: sizeValue},
            {right: sizeValue, top: sizeValue,bottom:'10%'},
            {left: sizeValue, top: sizeValue,bottom:'10%'}
        ],
        /*x 轴*/
        xAxis: [
            /*
            * type 坐标轴类型
            *   value  数值轴,适用于连续数据
            *   category 类目轴,适用于离散的类目数据
            *   time 时间轴
            *   log 对数轴
            * gridIndex  x 轴所在的 grid 的索引,默认位于第一个 grid
            * name 坐标轴名称
            * axisLabel 坐标轴刻度标签的相关设置
            *   rotate 刻度标签旋转的角度
            *   interval 坐标轴刻度标签的显示间隔。
            *       0 强制显示所有标签
            *       1 隔一个标签显示一个标签
            * boundaryGap 边界间隙
            *   false 无间隙
            *   true 有间隙
            * */
            {type: 'value', gridIndex: 0, name: '收入', axisLabel: {rotate: 50}},
            {type: 'category', gridIndex: 1, name: '国家',  axisLabel: {rotate: 50,}},
            {type: 'category', gridIndex: 2, name: '国家', axisLabel: {rotate: 50}},
            {type: 'value', gridIndex: 3, name: '寿命', axisLabel: {rotate: 50}}
        ],
        yAxis: [
            {type: 'value', gridIndex: 0, name: '寿命'},
            {type: 'value', gridIndex: 1, name: '收入'},
            {type: 'value', gridIndex: 2, name: '人口'},
            {type: 'value', gridIndex: 3, name: '人口'}
        ],
        dataset: {
            /*
            * dimensions 维度映射 []
            *   string,如 'someName',等同于 {name: 'someName'}
            *   Object
            *       name  string
            *       type 类型
            *           number,默认,表示普通数据。
            *           ordinal,对于类目、文本这些 string 类型的数据,如果需要能在数轴上使用,须是 'ordinal' 类型
            *           ...
            * */
            dimensions: ['收入','寿命','人口','国家','年'],
            /*数据源*/
            source: data
        },
        series: [
            /*
            * type 图表类型
            *   scatter 散点图
            *   symbolSize 散点大小
            *   xAxisIndex  x 轴索引位
            *   yAxisIndex  y 轴索引位
            *   encode 编码映射
            *       x  x坐标系的维度映射
            *       y  y坐标系的维度映射
            *       tooltip 提示映射
            *   itemStyle 项目样式
            *       opacity 项目透明度
            *
            * */
            {
                type: 'scatter',
                symbolSize: symbolSize,
                xAxisIndex: 0,
                yAxisIndex: 0,
                encode: {
                    x: '收入',
                    y: '寿命',
                    tooltip: [0, 1, 2, 3, 4]
                },
                itemStyle:{
                    opacity:0.3
                }
            },
            {
                type: 'scatter',
                symbolSize: symbolSize,
                xAxisIndex: 1,
                yAxisIndex: 1,
                encode: {
                    x: '国家',
                    y: '收入',
                    tooltip: [0, 1, 2, 3, 4]
                },
                itemStyle:{
                    opacity:0.3
                }
            },
            {
                type: 'scatter',
                symbolSize: symbolSize,
                xAxisIndex: 2,
                yAxisIndex: 2,
                encode: {
                    // x: '收入',
                    x: '国家',
                    y: '人口',
                    tooltip: [0, 1, 2, 3, 4]
                },
                itemStyle:{
                    opacity:0.3
                }
            },
            {
                type: 'scatter',
                symbolSize: symbolSize,
                xAxisIndex: 3,
                yAxisIndex: 3,
                encode: {
                    x: '寿命',
                    y: '人口',
                    tooltip: [0, 1, 2, 3, 4]
                },
                itemStyle:{
                    opacity:0.3
                }
            }
        ]
    };
4.区域缩放
效果:
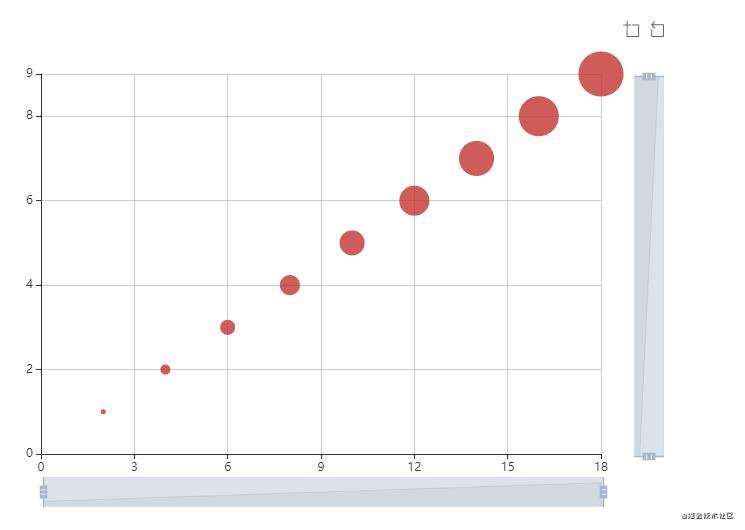
//数据源
const source = [
    //x  y  z
    [2,  1, 5],
    [4,  2, 10],
    [6,  3, 15],
    [8,  4, 20],
    [10, 5, 25],
    [12, 6, 30],
    [14, 7, 35],
    [16, 8, 40],
    [18, 9, 45],
];
const option = {
      tooltip: {},
      /*工具栏 toolbox
      *   feature{} 工具配置项
      *     dataZoom{} 框选型缩放缩放
      * */
      toolbox:{
        feature:{
            dataZoom:{}
        }
      },

      /*
      * x 轴
      *   min 最小值
      *       dataMin 取所有数据中的最小值
      *   max 最大值
      *       dataMax 取所有数据中的最大值
      * */
      xAxis: {
          type: 'value',
          min: 'dataMin',
          max: 'dataMax',
      },
      yAxis: {
          type: 'value',
          min: 'dataMin',
          max: 'dataMax',
      },
      /*
      * dataZoom 区域缩放 [{},{}]
      *   type 缩放方式
      *       inside 内置缩放,通过鼠标的平移缩放实现
      *       slider 滑动条缩放
      *   xAxisIndex 缩放作用于哪个x轴
      *   yAxisIndex 缩放作用于哪个y轴
      *   start 起始位,百分百 [0,100]
      *   end 结束位,百分百 [0,100]
      * */
      dataZoom:[
          {
              type:'inside',
              // start:50,
              // end:80
          },
          {
              type:'slider',
              yAxisIndex:0
          },
          {
              type:'slider',
              xAxisIndex:0
          },
      ],

      /*数据集*/
      dataset:{source},
      /*系列列表*/
      series: [
          {
              type: 'scatter',
              symbolSize: function (param) {
                    return param[2];
              },
          },
      ]
  };
5.视觉映射
效果:
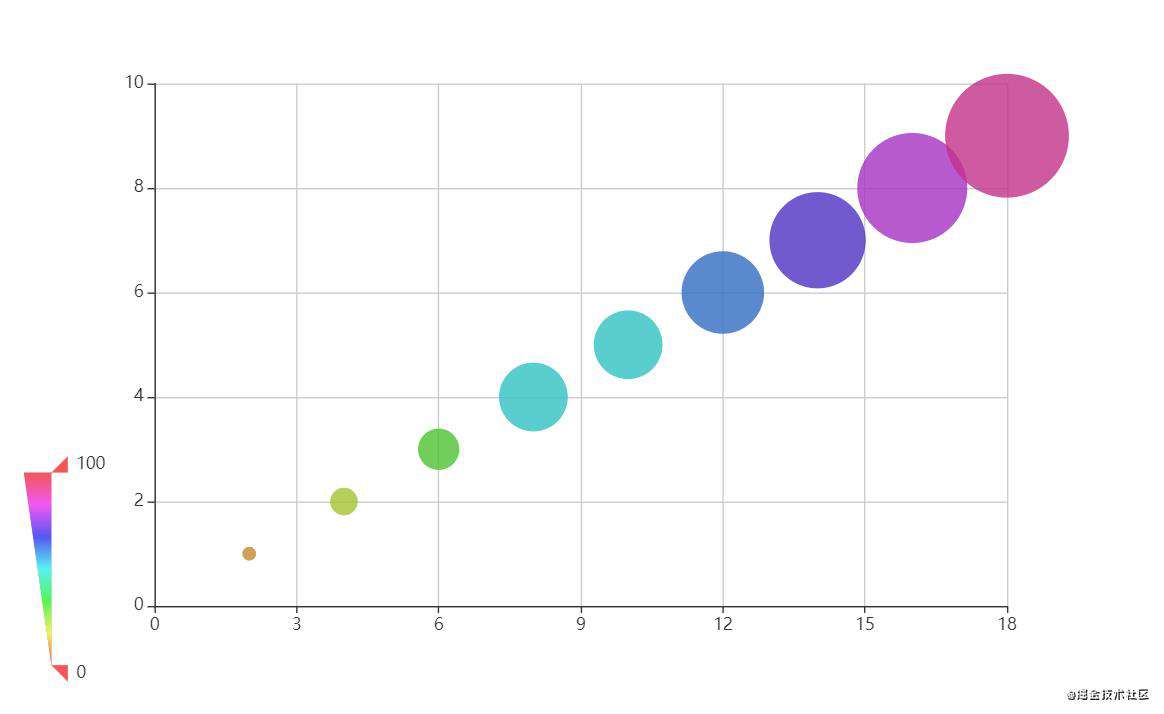
/*
  * visualMap 视觉映射 {}
  *   type 映射方式
  *       continuous 连续型
  *       piecewise 分段型
  *   min 映射区间的起始位置,如0
  *   max 映射区间的接收位置,如90
  *   calculable 是否显示拖拽用的手柄,只适用于连续型
  *   range [] 显示此范围内的项目,只适用于连续型,如[0,100]
  *   dimension 基于哪个维度的数据进行视觉映射
  *   inRange 自定义取色范围
  *       color[] 颜色映射
  *       symbolSize[] 大小映射
  *  举例如下
  * */
visualMap:{
      type:'continuous',
      min:0,
      max:100,
      calculable:true,
      // range:[1,9],
      // dimension:1,
      inRange:{
          // color:['#00acec','orange','green'],
          symbolSize:[0,100],
          colorHue:[0,360]
      }
  },
6.事件
6.1 鼠标事件,以click为例
echarts官网中的定义:
{
    // 当前点击的图形元素所属的组件名称,
    // 其值如 'series'、'markLine'、'markPoint'、'timeLine' 等。
    componentType: string,
    // 系列类型。值可能为:'line'、'bar'、'pie' 等。当 componentType 为 'series' 时有意义。
    seriesType: string,
    // 系列在传入的 option.series 中的 index。当 componentType 为 'series' 时有意义。
    seriesIndex: number,
    // 系列名称。当 componentType 为 'series' 时有意义。
    seriesName: string,
    // 数据名,类目名
    name: string,
    // 数据在传入的 data 数组中的 index
    dataIndex: number,
    // 传入的原始数据项
    data: Object,
    // sankey、graph 等图表同时含有 nodeData 和 edgeData 两种 data,
    // dataType 的值会是 'node' 或者 'edge',表示当前点击在 node 还是 edge 上。
    // 其他大部分图表中只有一种 data,dataType 无意义。
    dataType: string,
    // 传入的数据值
    value: number|Array,
    // 数据图形的颜色。当 componentType 为 'series' 时有意义。
    color: string,
    // 用户自定义的数据。只在 graphic component 和自定义系列(custom series)
    // 中生效,如果节点定义上设置了如:{type: 'circle', info: {some: 123}}。
    info: *
}
myChart.on('click',(param)=>{
     console.log(param);
})
6.2组件交互
以legendselectchanged为例:
myChart.on('legendselectchanged',(param)=>{
    console.log(param);
})
6.3触发图表行为:dispatchAction
效果:
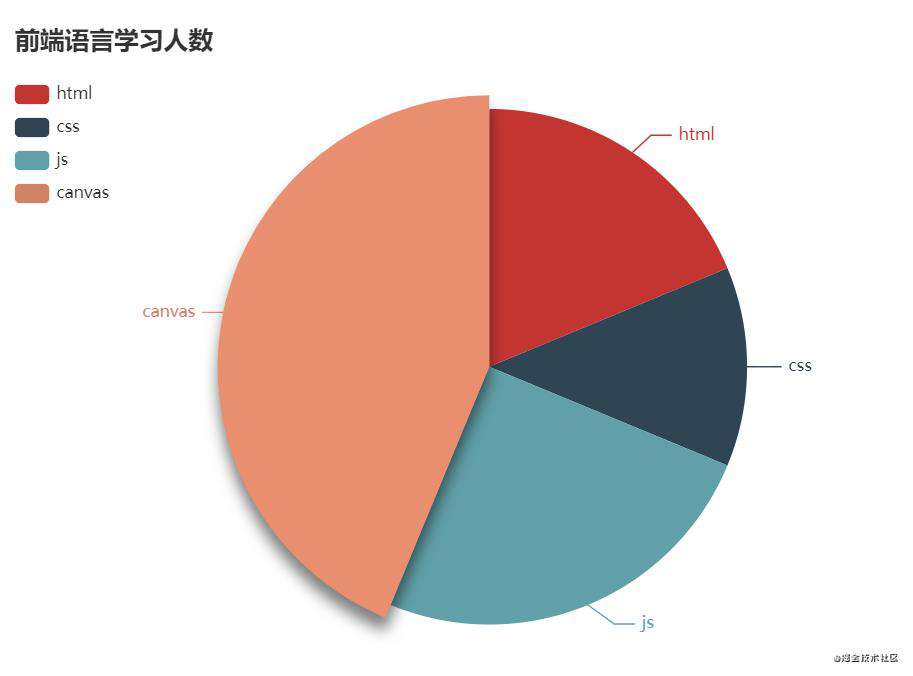
/*使用dispatchAction 方法高亮并提示一个扇形
*   type 触发的行为类型
*       highlight 高亮
*       showTip 显示提示
*       downplay 取消高亮
*       hideTip 取消提示
*   seriesIndex 系列索引,用于寻找系列列表中的某个系列
*   dataIndex 数据所有,用于寻找系列中的某个元素
* */
myChart.dispatchAction({
        type:'highlight',
        seriesIndex:0,
        dataIndex:3
    })
// myChart.dispatchAction({
//     type:'showTip',
//     seriesIndex:0,
//     dataIndex:3
// })

// myChart.dispatchAction({
//     type:'downplay',
//     seriesIndex:0,
//     dataIndex:3
// })
// myChart.dispatchAction({
//     type:'hideTip',
//     seriesIndex:0,
//     dataIndex:3
// })
7.富文本
效果:
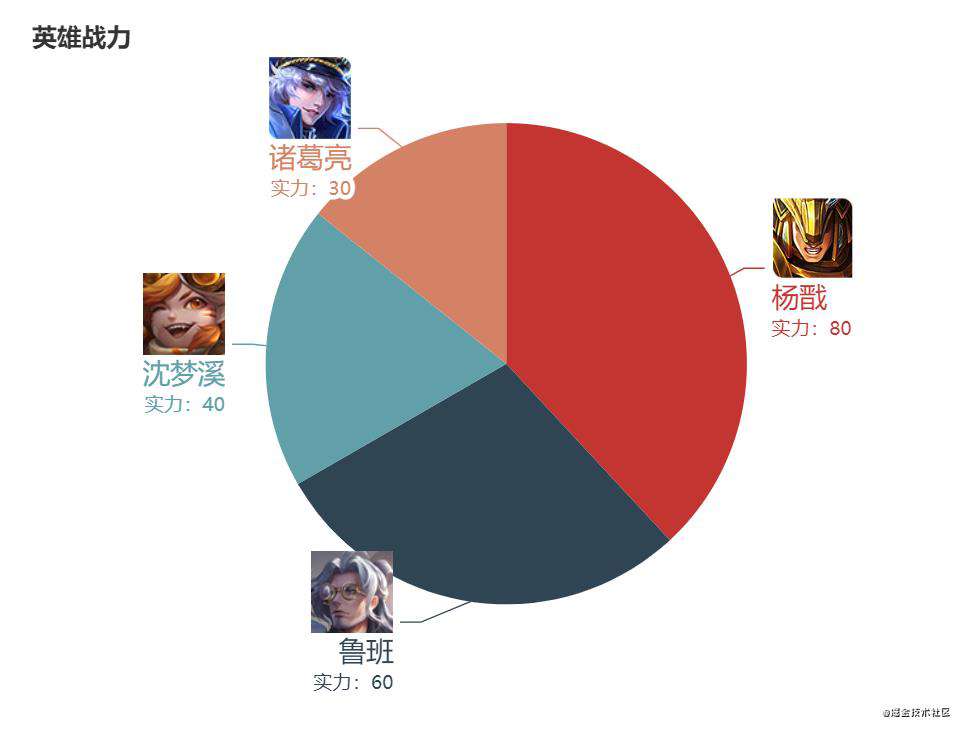
// 数据
const data=[
    {name:'杨戬',value:80,img:'./images/yj.jpg'},
    {name:'鲁班',value:60,img:'./images/lb.jpg'},
    {name:'沈梦溪',value:40,img:'./images/smx.jpg'},
    {name:'诸葛亮',value:30,img:'./images/zgl.jpg'}
];

data.forEach(item=>{
    /*自定义标签 label
    *   formatter 文本片段
    *       '{样式名|文字内容}\n 换行'
    *   文本块的样式
    *       textBorderColor 文本描边颜色
    *       textBorderWidth 文本描边宽度
    *       ...
    *   rich 富文本,在其中写入样式
    *       width 宽
    *       height 高
    *       backgroundColor 背景色
    *           image 背景图
    *       fontSize 文字大小
    *       lineHeight 行高
    *       fontWeight 文本加粗
    *       ...
    * */
    item.label = {
        formatter:'{img|}\n{name|'+item.name+'}\n'+'{val|实力:'+item.value+'}',
        rich:{
            img:{
                width: 50,
                height: 50,
                backgroundColor:{
                    image: item.img
                }
            },
            name:{
                fontSize: 14,
                lineHeight: 20,
            }
        }
    }
})


/*配置项*/
const option = {
    title:{text:'英雄战力'},
    tooltip: {trigger: 'item'}
    series: {
        type: 'pie',
        data,
        radius:'70%',
    }
};
常见问题FAQ
- 免费下载或者VIP会员专享资源能否直接商用?
- 本站所有资源版权均属于原作者所有,这里所提供资源均只能用于参考学习用,请勿直接商用。若由于商用引起版权纠纷,一切责任均由使用者承担。更多说明请参考 VIP介绍。
- 提示下载完但解压或打开不了?
- 找不到素材资源介绍文章里的示例图片?
- 模板不会安装或需要功能定制以及二次开发?


发表评论
还没有评论,快来抢沙发吧!