1. 写在前面
最近在看 Ubur 的 Deck.gl,间接性接触到它们开源的一个地理数据分析可视化工具 kepler.gl,之前也有看到,没有怎么玩过,恰好最近有点时间,来玩一玩这个地理数据可视化工具。
下面就以探索的方式展开简单玩玩 kepler.gl。
1.1 开源可视化库
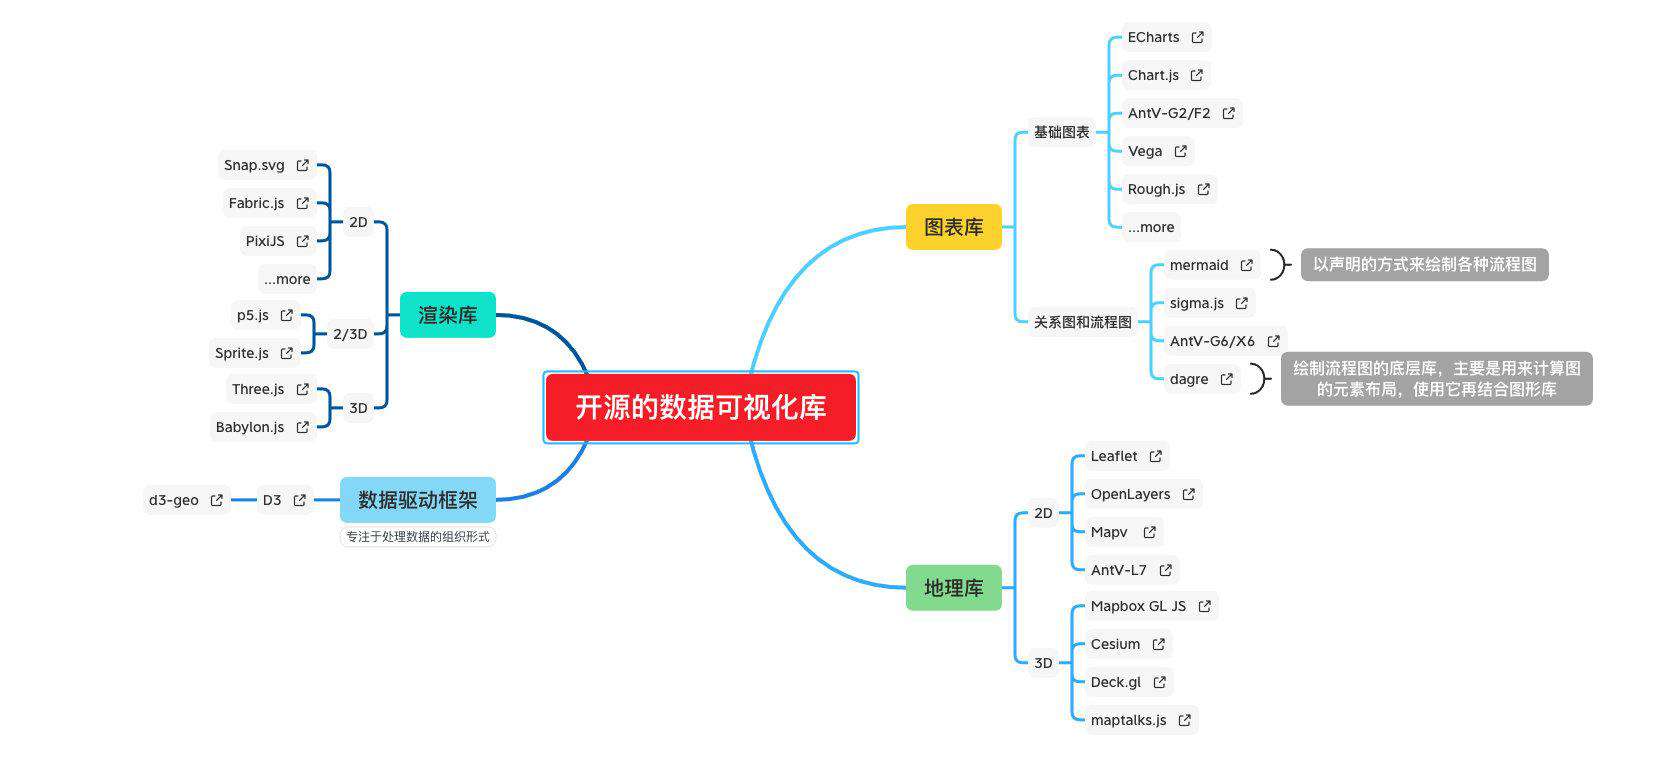
1.1.1 简单分类
图表库
-
基础图表
-
ECharts
-
Chart.js
-
AntV-G2/F2
-
Vega
-
Rough.js
-
...more
-
-
关系图和流程图
- mermaid
-
sigma.js
- AntV-G6/X6
-
dagre
- ...more
地理库
-
2D
-
Leaflet
-
OpenLayers
-
Mapv
-
AntV-L7
-
3D
- Mapbox GL JS
-
Cesium
- Deck.gl
-
maptalks.js
- ...more
数据驱动框架
- D3
- d3-geo
- ...more
渲染库
-
2D
-
Snap.svg
-
Fabric.js
-
PixiJS
-
...more
-
-
2/3D
-
p5.js
-
Sprite.js
-
-
3D
-
Three.js
-
Babylon.js
-
1.1.2 简单关系图
1.2 kepler.gl 了解
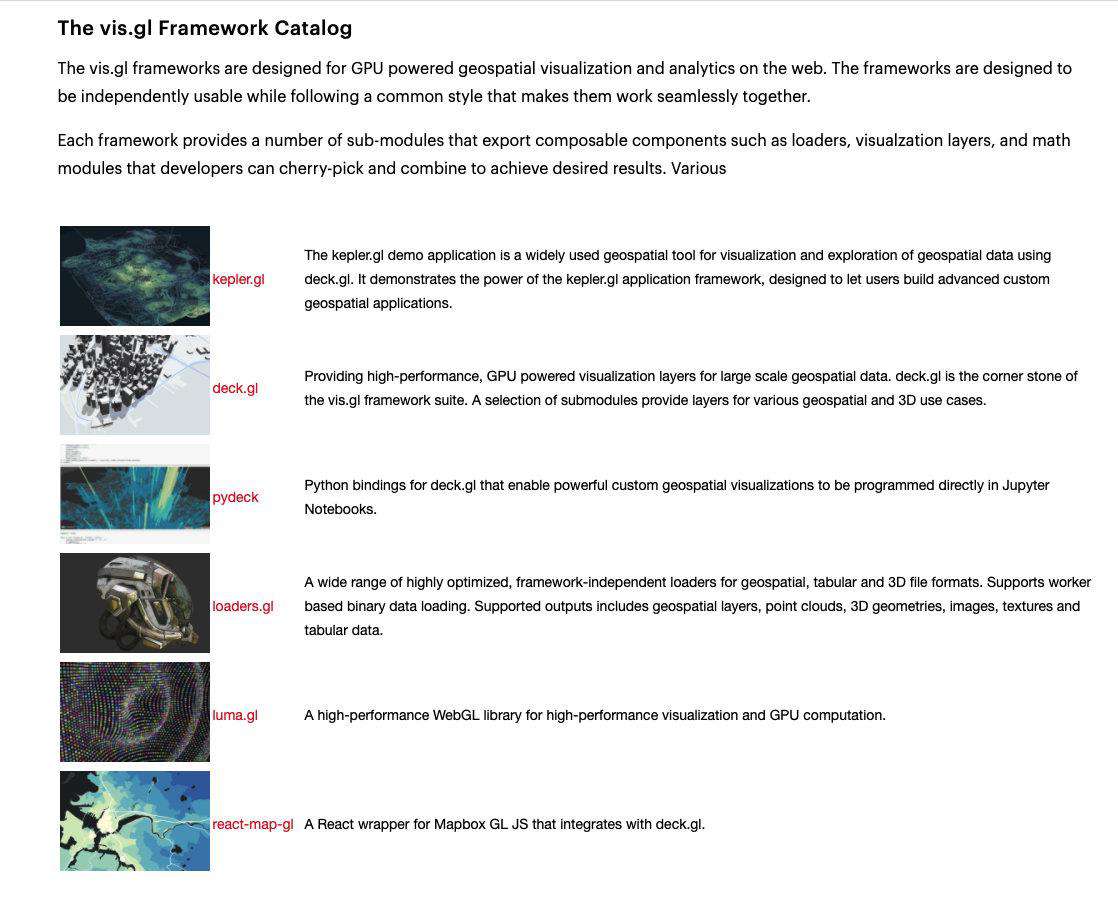
提到 deck.gl 就自然要了解一下地理空间可视化框架 Vis.gl 的生态:
- deck.gl - A high-performance WebGL 2 rendering framework for big data visualizations that integrates perfectly with reactive applications.
- react-map-gl - A React wrapper around Mapbox GL which works seamlessly with deck.gl.
- React-vis- A composable, deeply customizable charting library
- luma.gl - A comprehensive set of WebGL 2 components targeting high-performance rendering and GPGPU computing.
- loaders.gl - a suite of framework-independent loaders for file formats focused on visualization of big data, including point clouds, 3D geometries, images, geospatial formats as well as tabular data.
- nebula.gl - High-Performance, 3D-enabled GeoJSON editing deck.gl and React
了解大致关系情况后,就搭建 kepler.gl,来玩一玩看看。
2. 搭建 kepler.gl
2.1 生成项目、安装依赖
生成项目使用 create-react-app 脚手架工具
npx create-react-app kepler.gl-taste
cd kepler.gl-taste
安装 kepler.gl相关依赖,kepler.gl 使用 Redux 管理组件状态,这里需要安装 redux, react-redux
npm install --save kepler.gl redux react-redux react-virtualized styled-components
安装 react-virtualized 需要使用到 AutoSizer 组件,方便自动调整适配屏幕
2.2 添加相关代码
使用 Redux 创建状态管理 store.js
import { createStore, combineReducers, applyMiddleware, compose } from "redux";
import keplerGlReducer from "kepler.gl/reducers";
import { enhanceReduxMiddleware } from "kepler.gl/middleware";

const initialState = {};

const customizedKeplerGlReducer = keplerGlReducer.initialState({
	// TODO: customize initial state
});

const reducers = combineReducers({
  keplerGl: customizedKeplerGlReducer,
	// TODO: app reducer
  // app: appReducer
});

export const middlewares = enhanceReduxMiddleware([
  // Add other middlewares here
]);

export const enhancers = [applyMiddleware(...middlewares)];

// using createStore
export default createStore(reducers, initialState, compose(...enhancers));
挂载 KeplerGl 组件 app.js
import AutoSizer from "react-virtualized/dist/commonjs/AutoSizer";
import KeplerGl from "kepler.gl";
import "./App.css";

const MAPBOX_TOKEN = process.env.REACT_APP_MAPBOX_TOKEN; // eslint-disable-line
const MAPBOX_API_URL = "https://api.mapbox.com";

function App() {
  return (
    <div className="App">
      <AutoSizer>
        {({ height, width }) => (
          <KeplerGl
            mapboxApiAccessToken={MAPBOX_TOKEN}
            id="map"
            width={width}
            height={height}
            mapboxApiUrl={MAPBOX_API_URL}
          />
        )}
      </AutoSizer>
    </div>
  );
}

export default App;
挂载 APP 组件,注入 store,index.js
import React from "react";
import ReactDOM from "react-dom";
import { Provider } from "react-redux";
import store from "./store";
import App from "./App";
import "./index.css";

ReactDOM.render(
  <Provider store={store}>
    <App />
  </Provider>,
  document.getElementById("root")
);
更多相关代码查看 kepler.gl-taste
2.3 部署
之前一般选择 Vercel 与 travis-ci 来持续集成部署,现在 Github Actions 也比较好用了,这里就使用 Github Actions 来做持续集成。
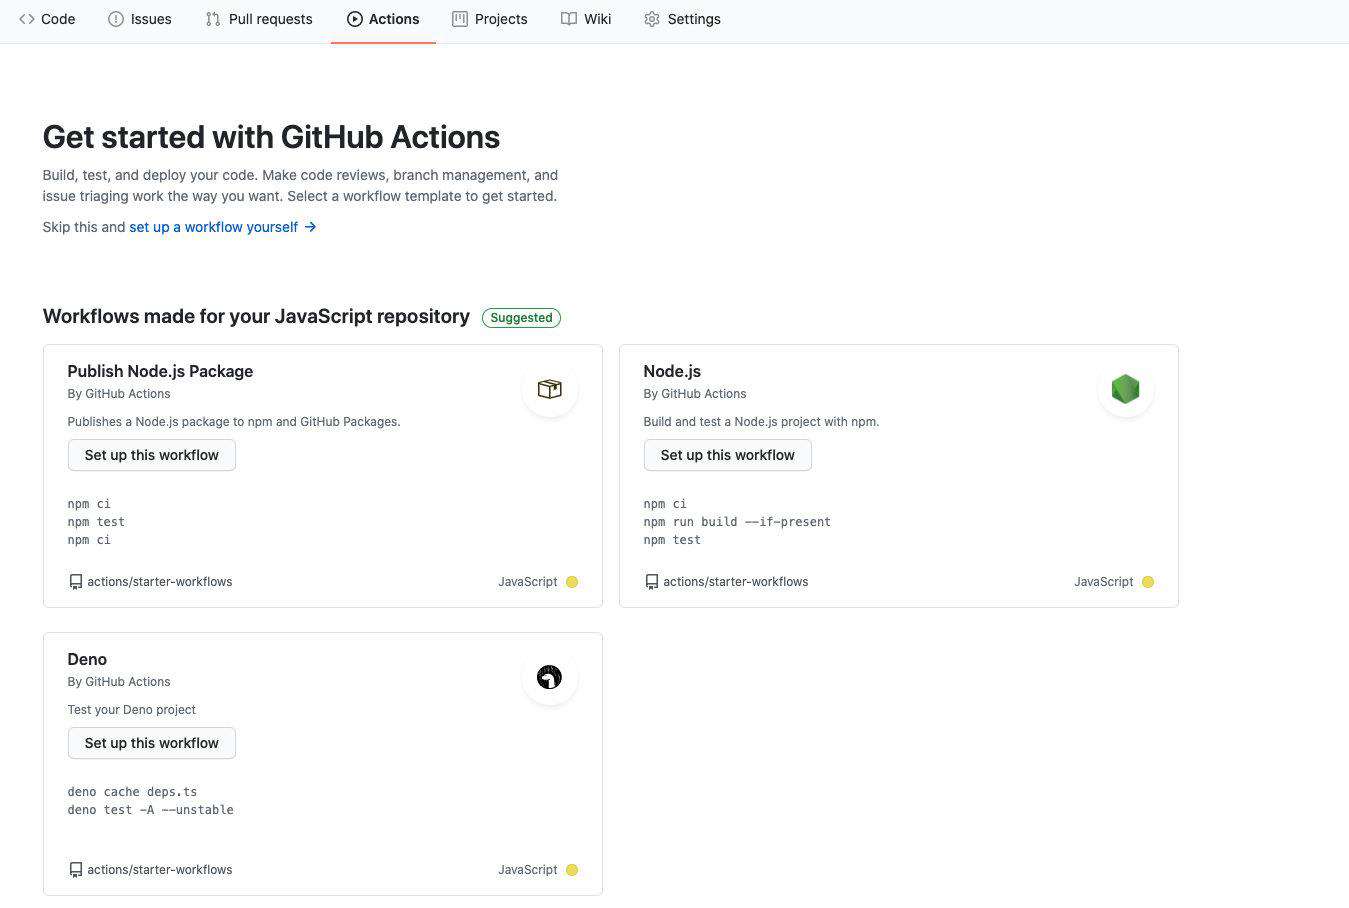
新建工作流,配置 Actions deploy-gh-page.yml
name: deploy gh-pag CI

on:
  push:
    branches: [ main ]
  pull_request:
    branches: [ main ]

jobs:
  deploy:

    runs-on: ubuntu-latest

    strategy:
      matrix:
        node-version: [14.x]

    steps:
    - uses: actions/checkout@v2
    - name: Use Node.js ${{ matrix.node-version }}
      uses: actions/setup-node@v2
      with:
        node-version: ${{ matrix.node-version }}
    - run: npm install
    - run: npm run build

    - name: deploy
      uses: peaceiris/actions-gh-pages@v3
      with:
        github_token: ${{ secrets.ACCESS_TOKEN }}
        publish_dir: ./build
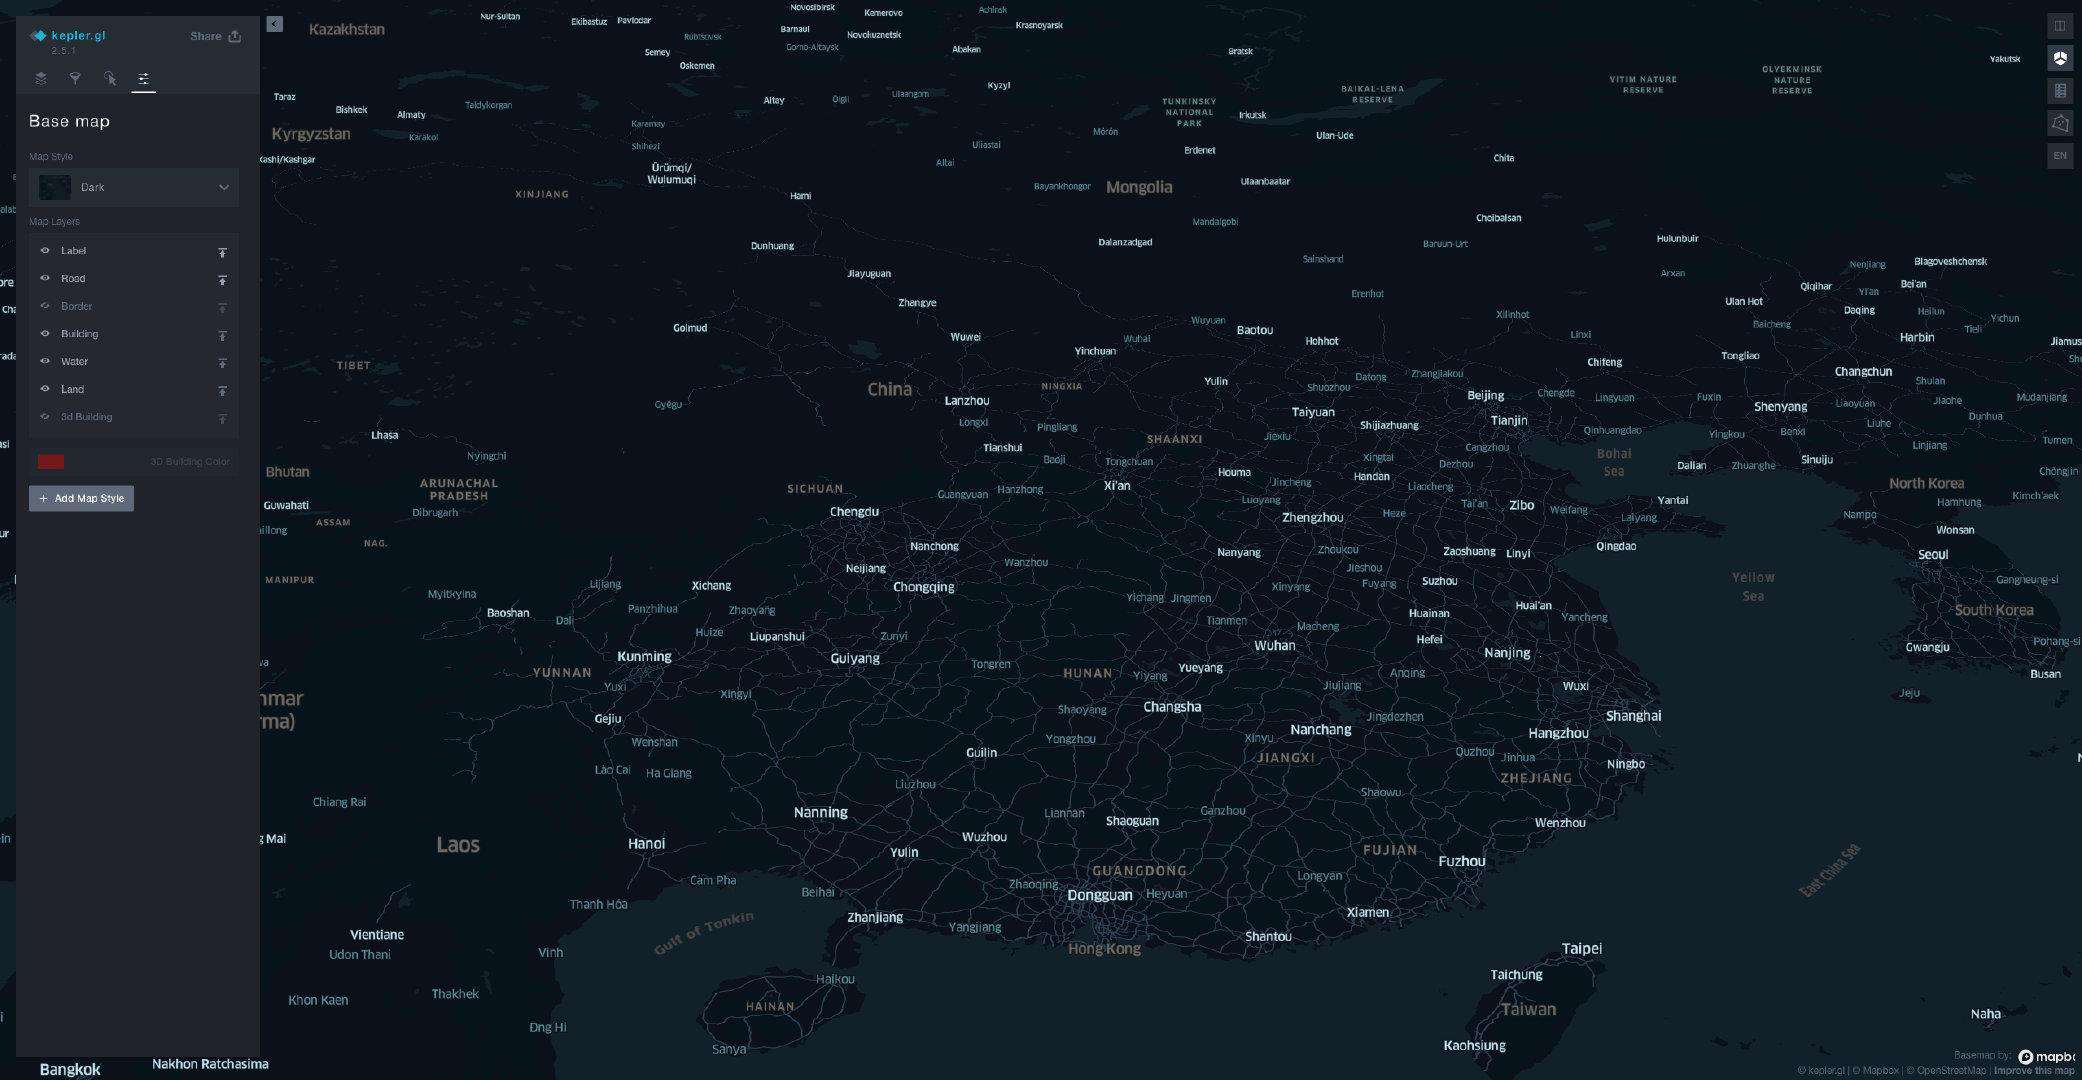
部署完成之后,访问部署后的地址,下就开始来玩玩 kepler.gl
3. 使用 kepler.gl
3.1 拾取要分析的数据
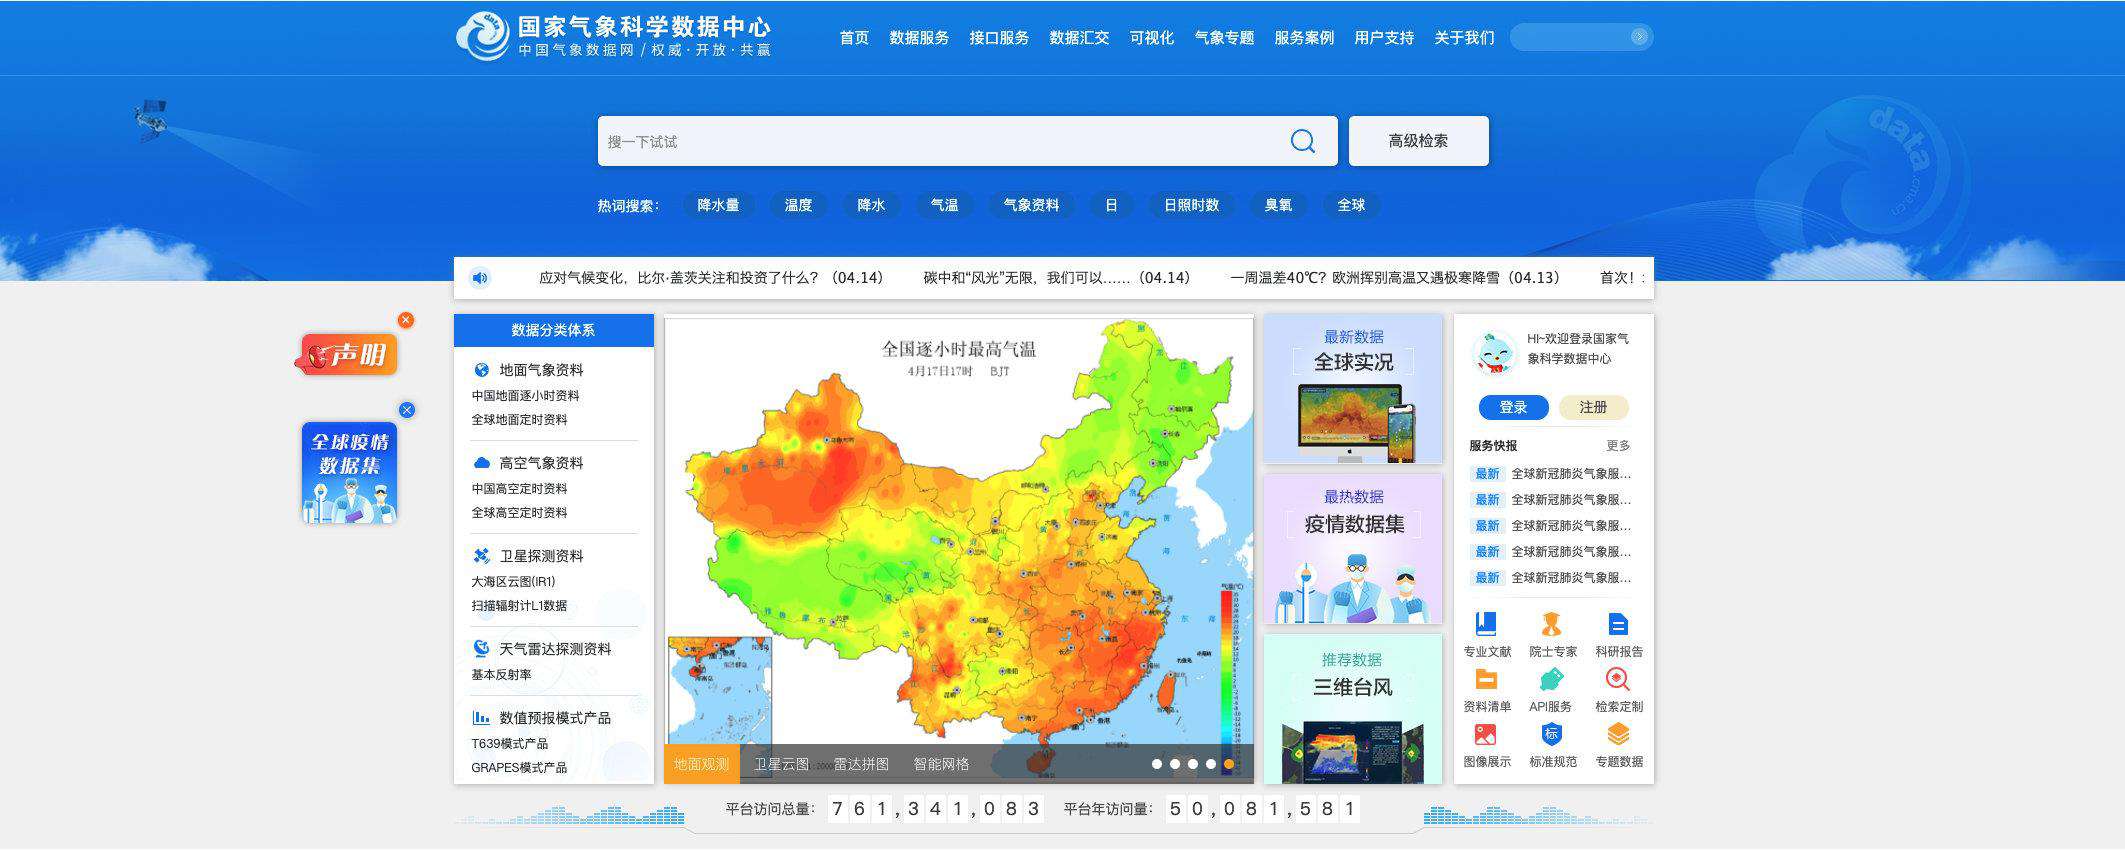
这里就以带地理信息的天气数据来玩玩 kepler.gl 看看效果,数据就使用国家气象科学数据中心收集的地面站点数据。不过使用数据之前需要注册帐号,审核通过之后就可以使用了。
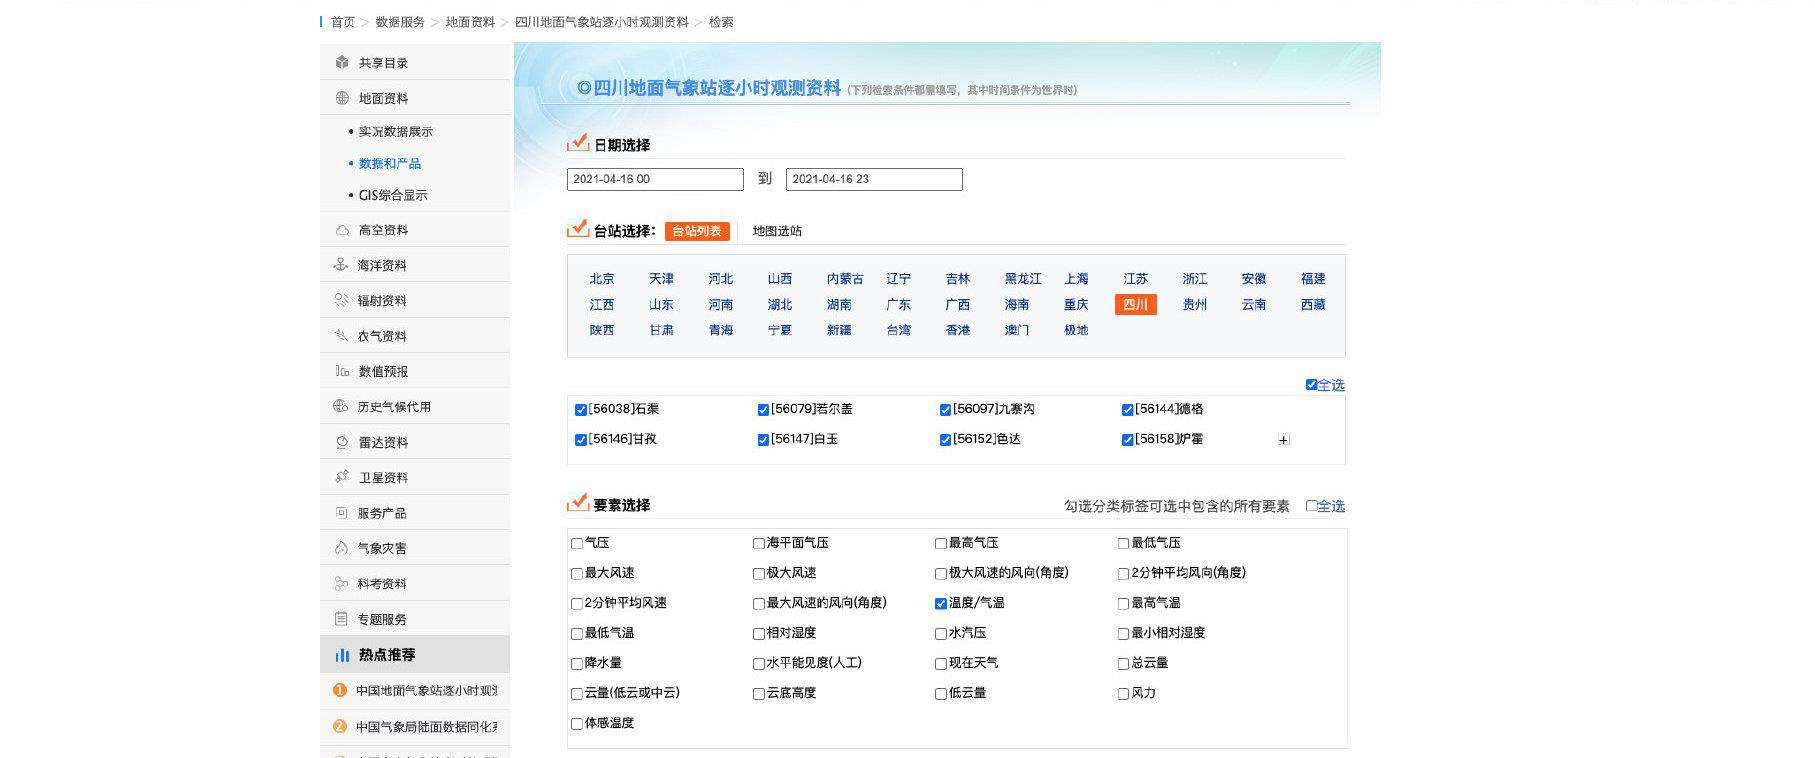
这里就以四川地面气象站逐小时观测资料为演示数据,选取要观测要素,数据检索完成后,申请数据下载。
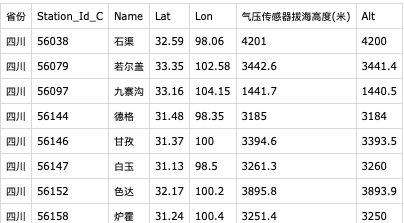
审核通过后下载数据,数据格式如下图所示:

可以看到数据只要站点编号,缺少站点信息数据,再次下载站点数据,数据格式如下图所示:
下面进行数据合并处理
3.2 处理数据
编写 JS 脚本处理两个 CSV 数据格式,将只要站点编号的文件注入站点信息,为了方便处理这里导出为 Json 文件。
const fs = require("fs")

const parseToJson = (data) => {
	const lines = data.trim().split(/[\r?\n]{1,2}/)
	const rows = lines.map((line) => line.trim().split(','))
	const headRow = rows.slice(0, 1)[0]
  const bodyRows = rows.slice(1)

  const headMap = headRow.reduce((pre, cur, index) => {
      pre.set(index, cur)
      return pre
    }, new Map())

  const records = bodyRows.map((row) => {
      const initialValue = {}
      const record = row.reduce((pre, cur, index) => {
        const key = headMap.get(index)

        if (key) {
          const vaule = Number(cur)
          if (cur === '' || Number.isNaN(vaule)) {
            pre[key] = cur
          } else {
            pre[key] = vaule
          }
        }
        return pre
      }, initialValue)
      return record
    })

  return records
}

const Station_Id_C = fs.readFileSync('./Station_Id_C.csv').toString();
const SrouceData = fs.readFileSync('./SrouceData.csv').toString();

const srouceData = parseToJson(SrouceData)
const stationJson = parseToJson(Station_Id_C)

const stationMap = new Map()

for (item of stationJson) {
		stationMap.set(item.Station_Id_C, item)
}

for (item of srouceData) {
	const station = stationMap.get(item.Station_Id_C)
	item.Lat = station.Lat
	item.Lon = station.Lon
	item.Alt = station.Alt
	item.Name = station.Name
}

fs.writeFileSync('result.json', JSON.stringify(srouceData))
3.3 使用数据
3.3.1 操作示例
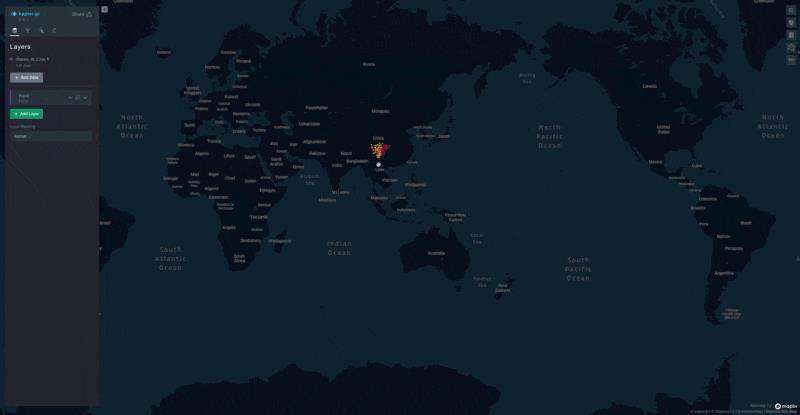
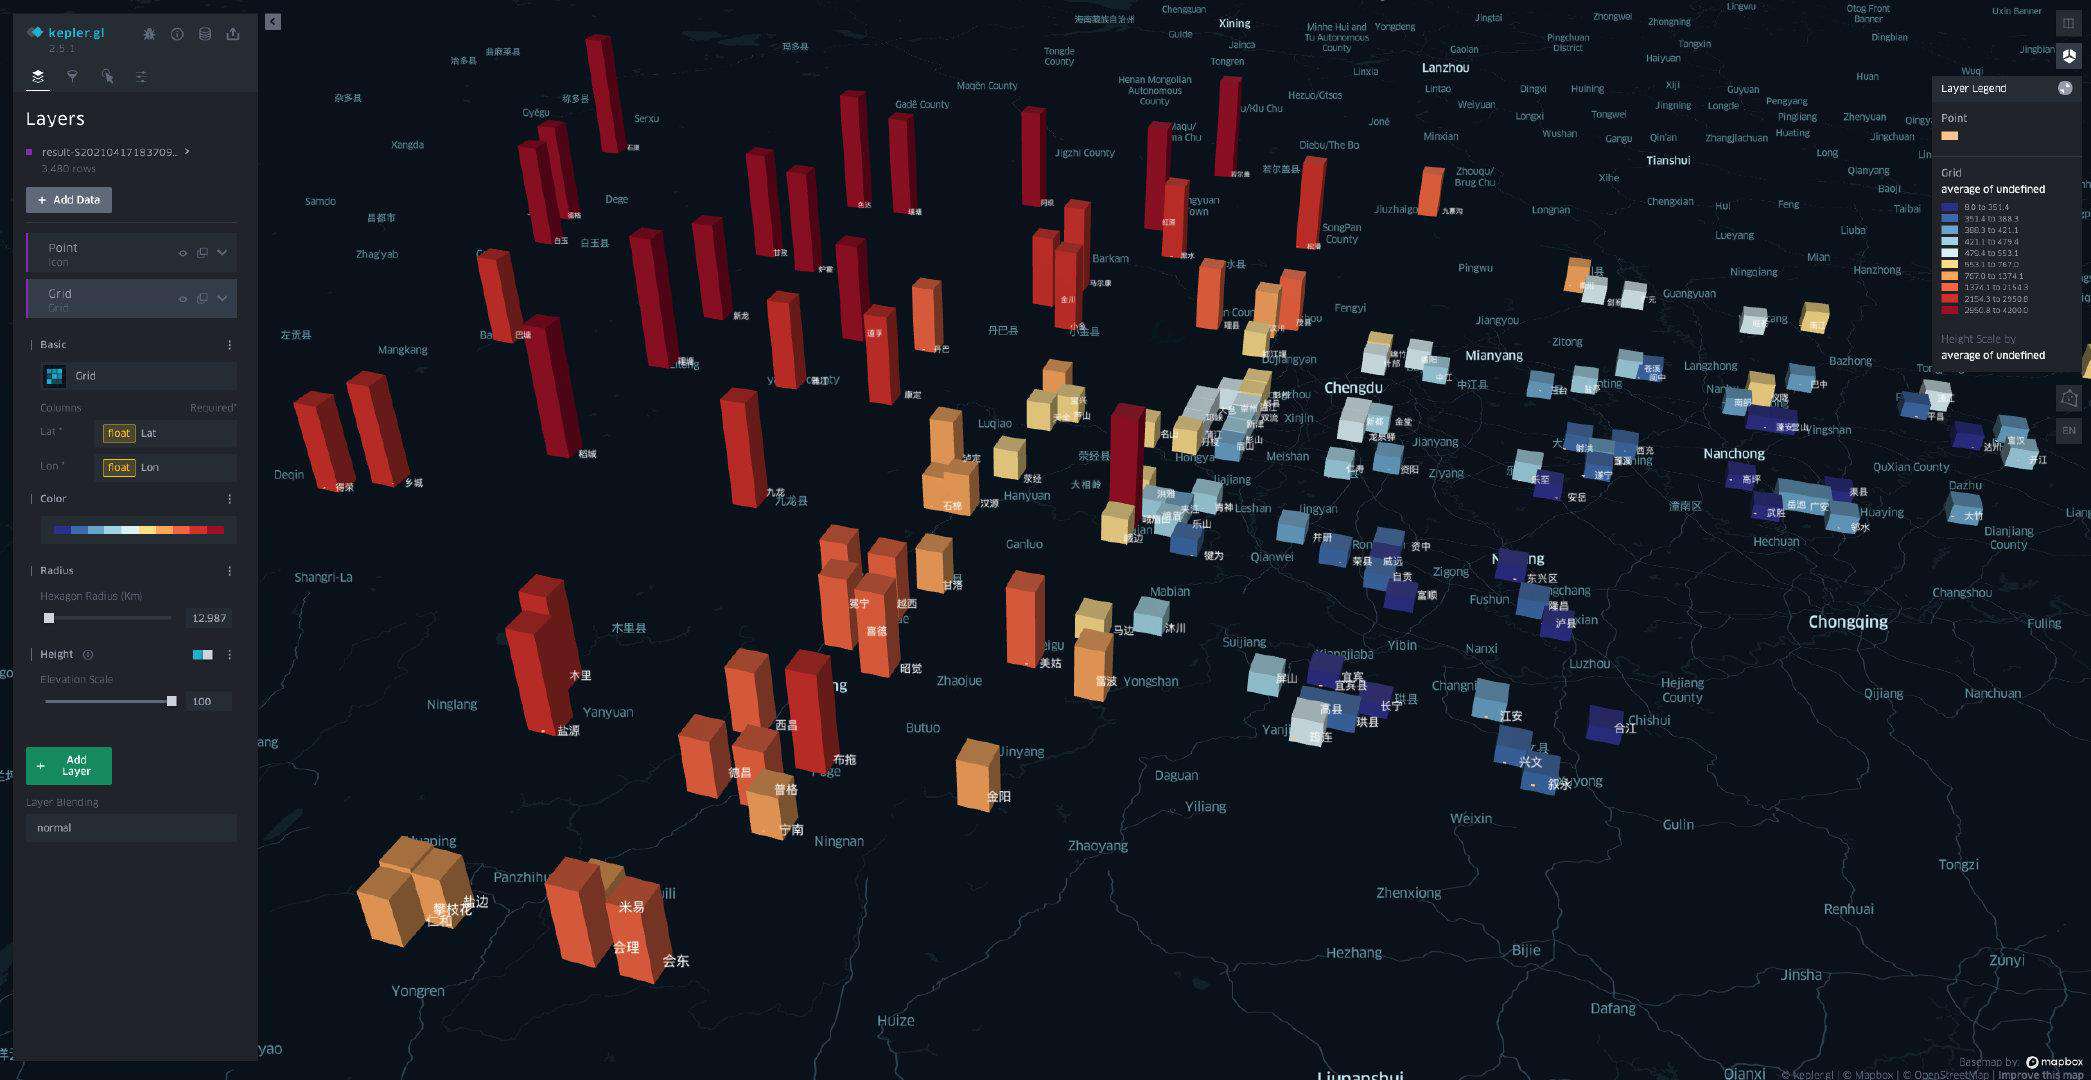
3.3.2 各气象站点海拔高度分布
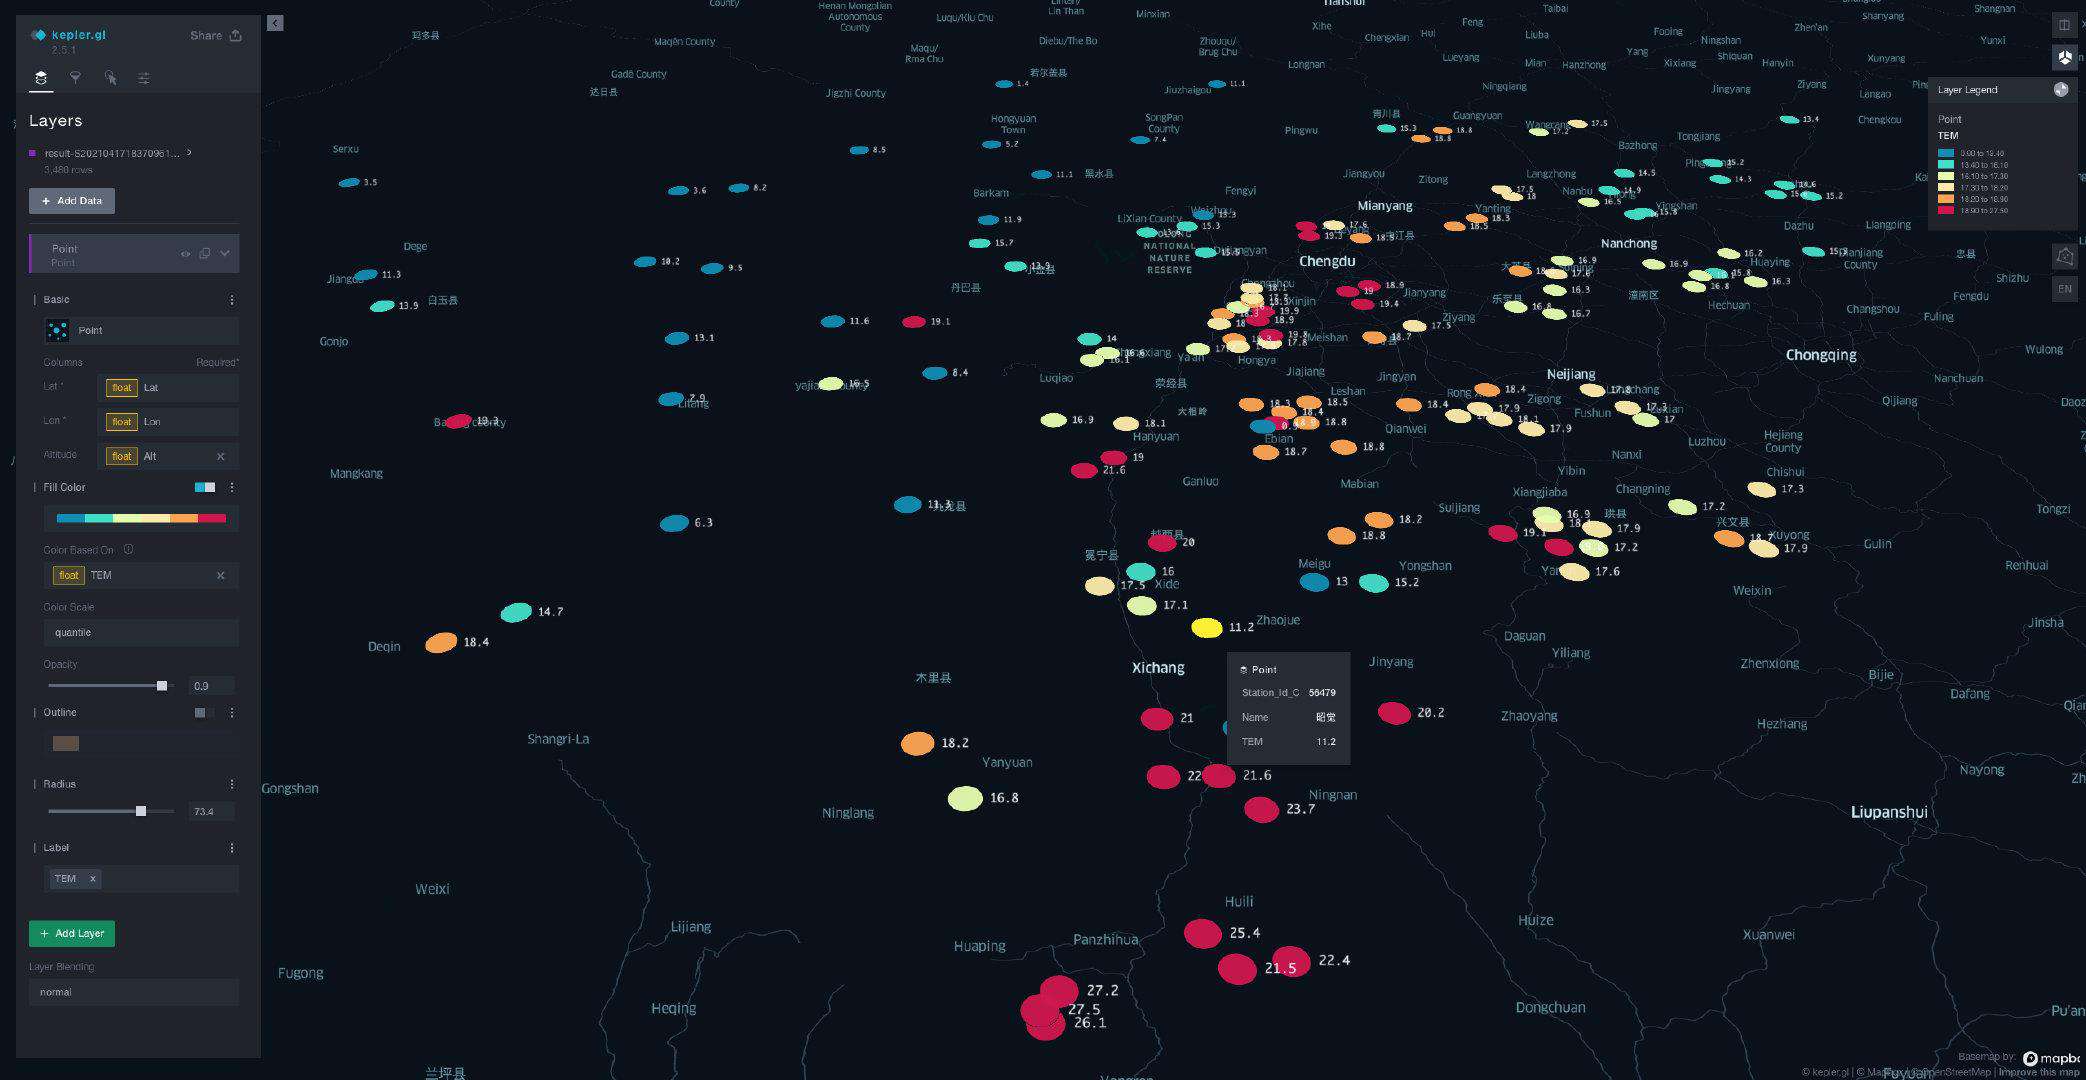
3.3.3 各气象站点中午气温分布
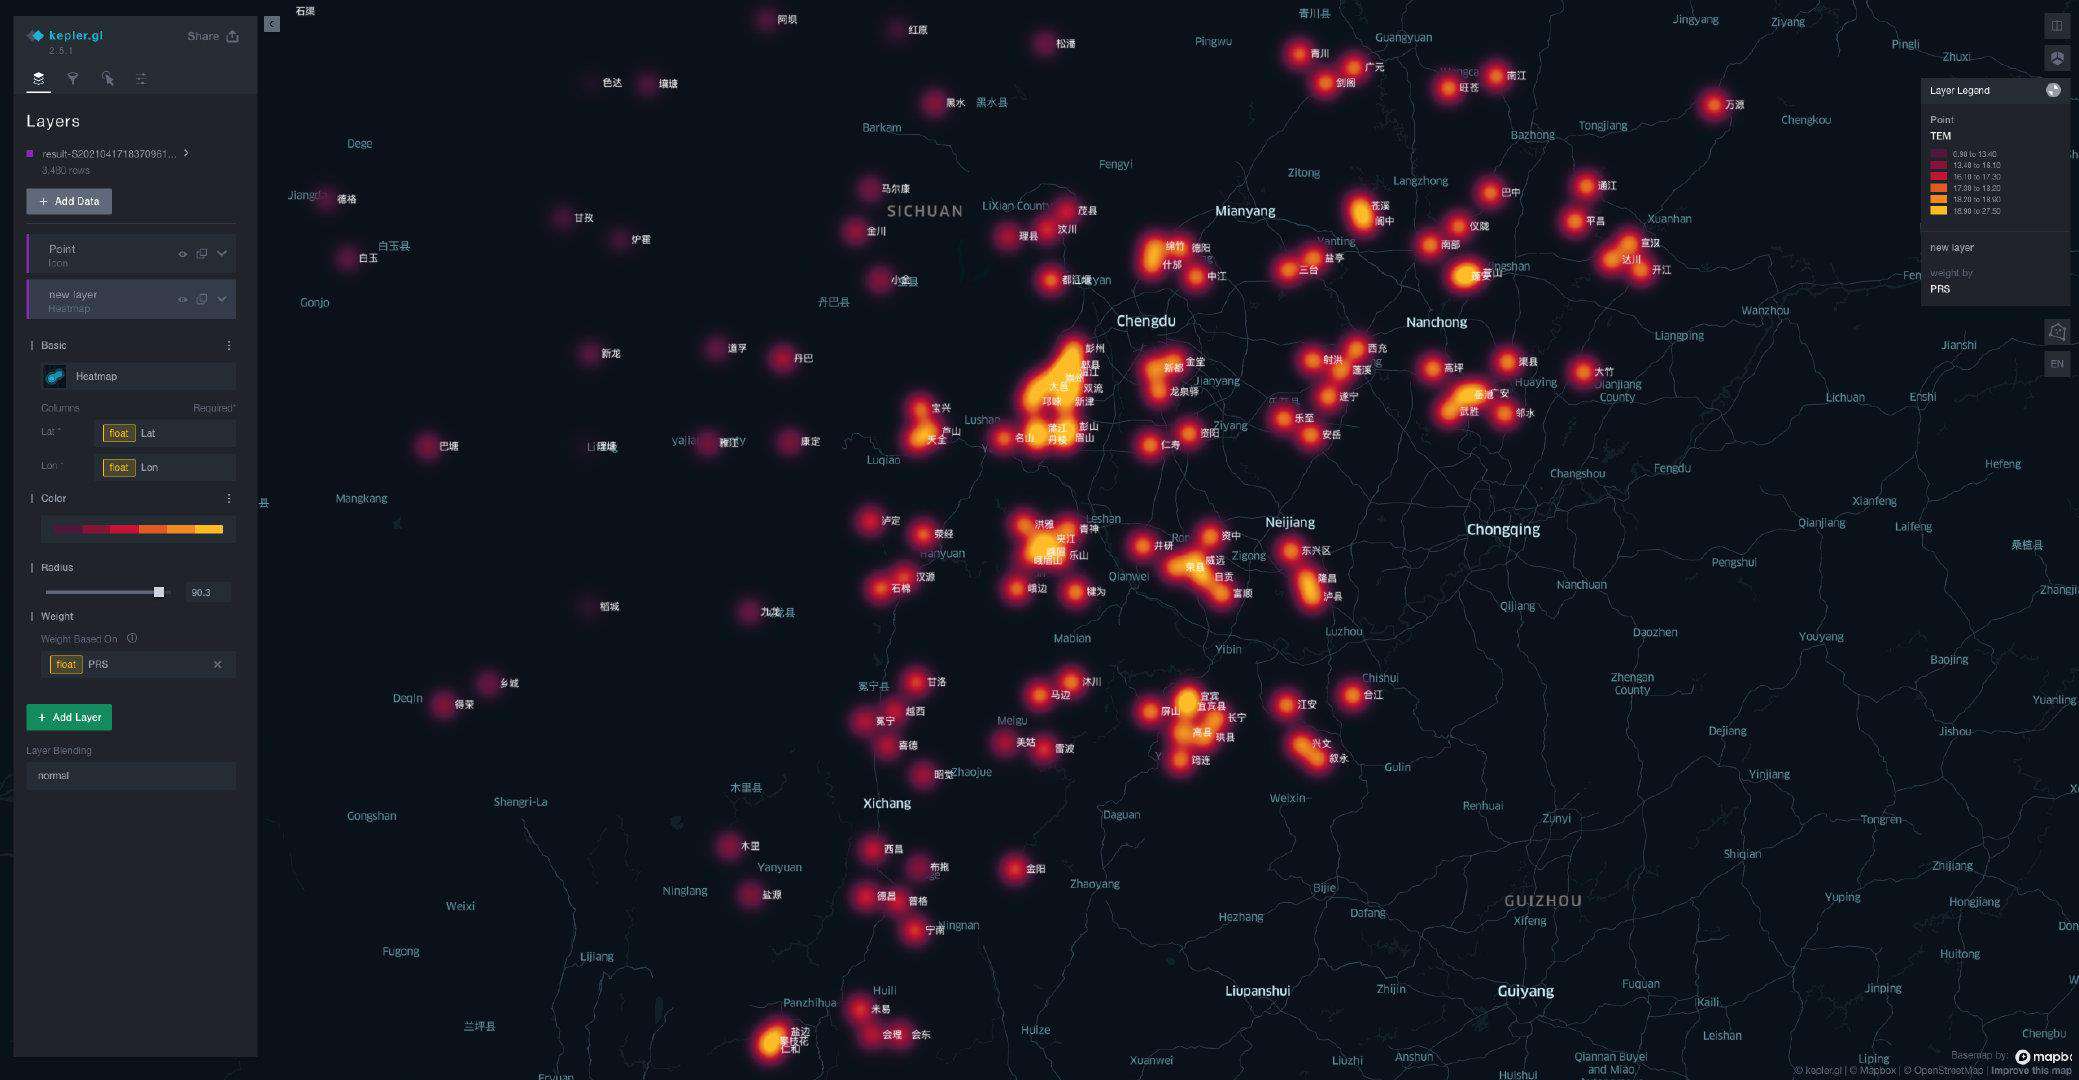
3.3.4 各气象站点中午气压热力图
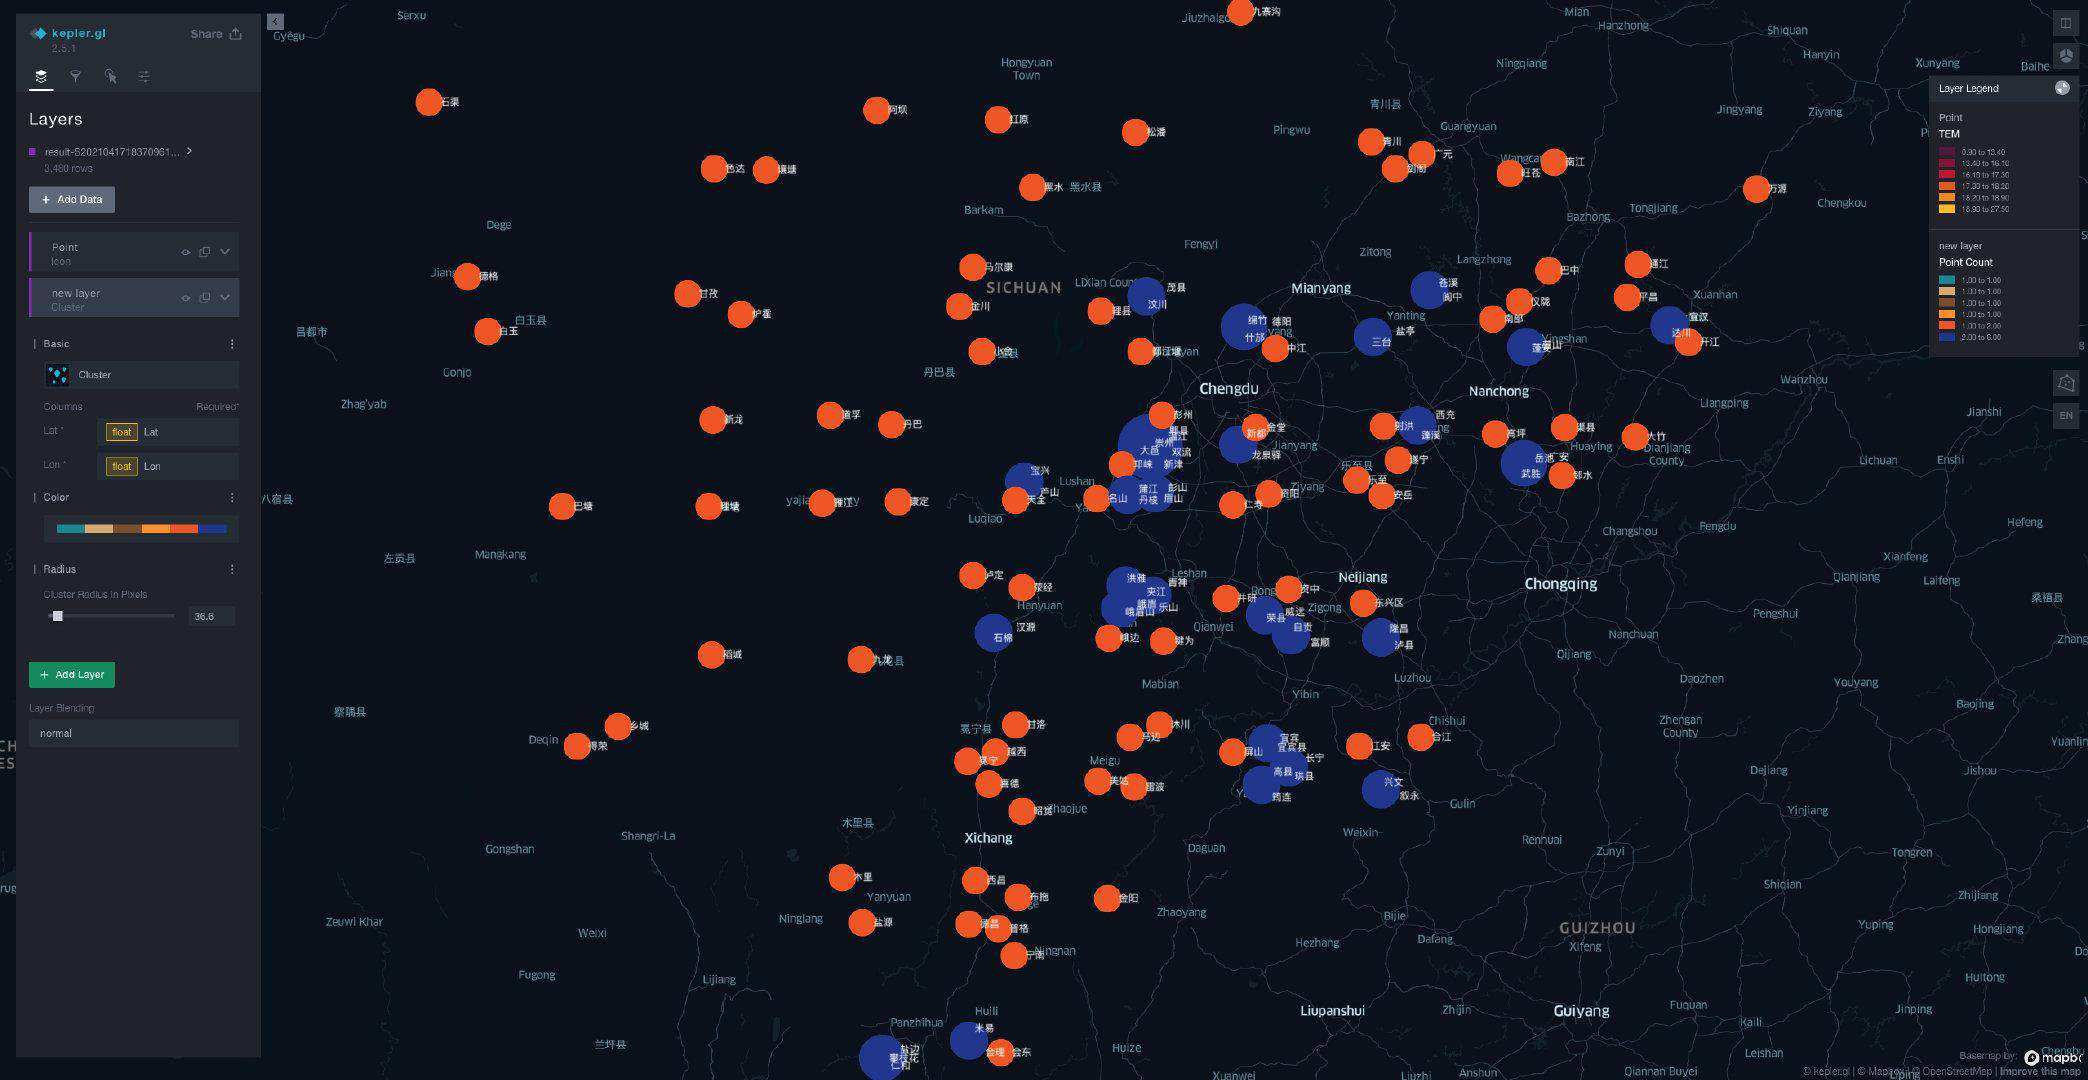
3.3.5 各气象站点聚合分布图
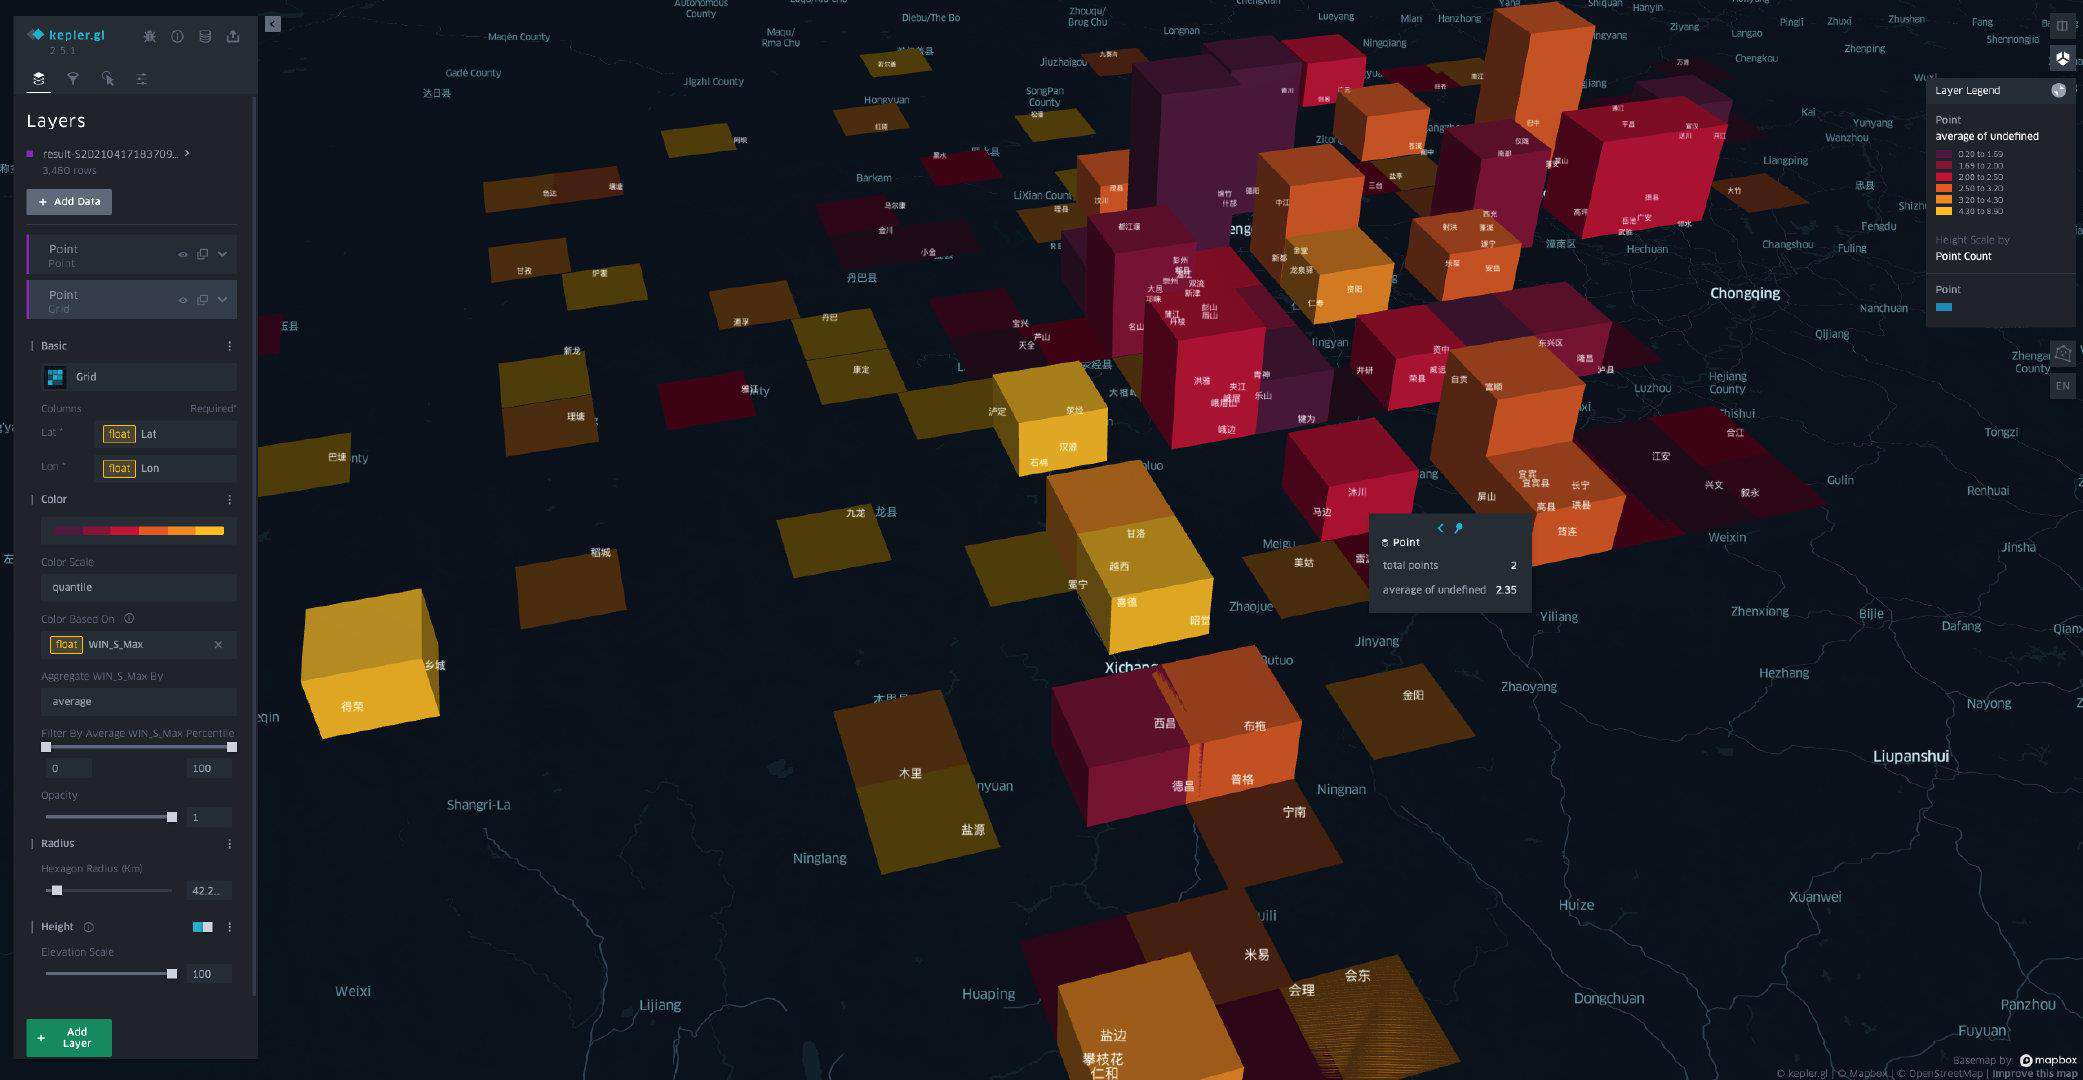
3.3.6 各气象站点栅格化最大风速三维视图
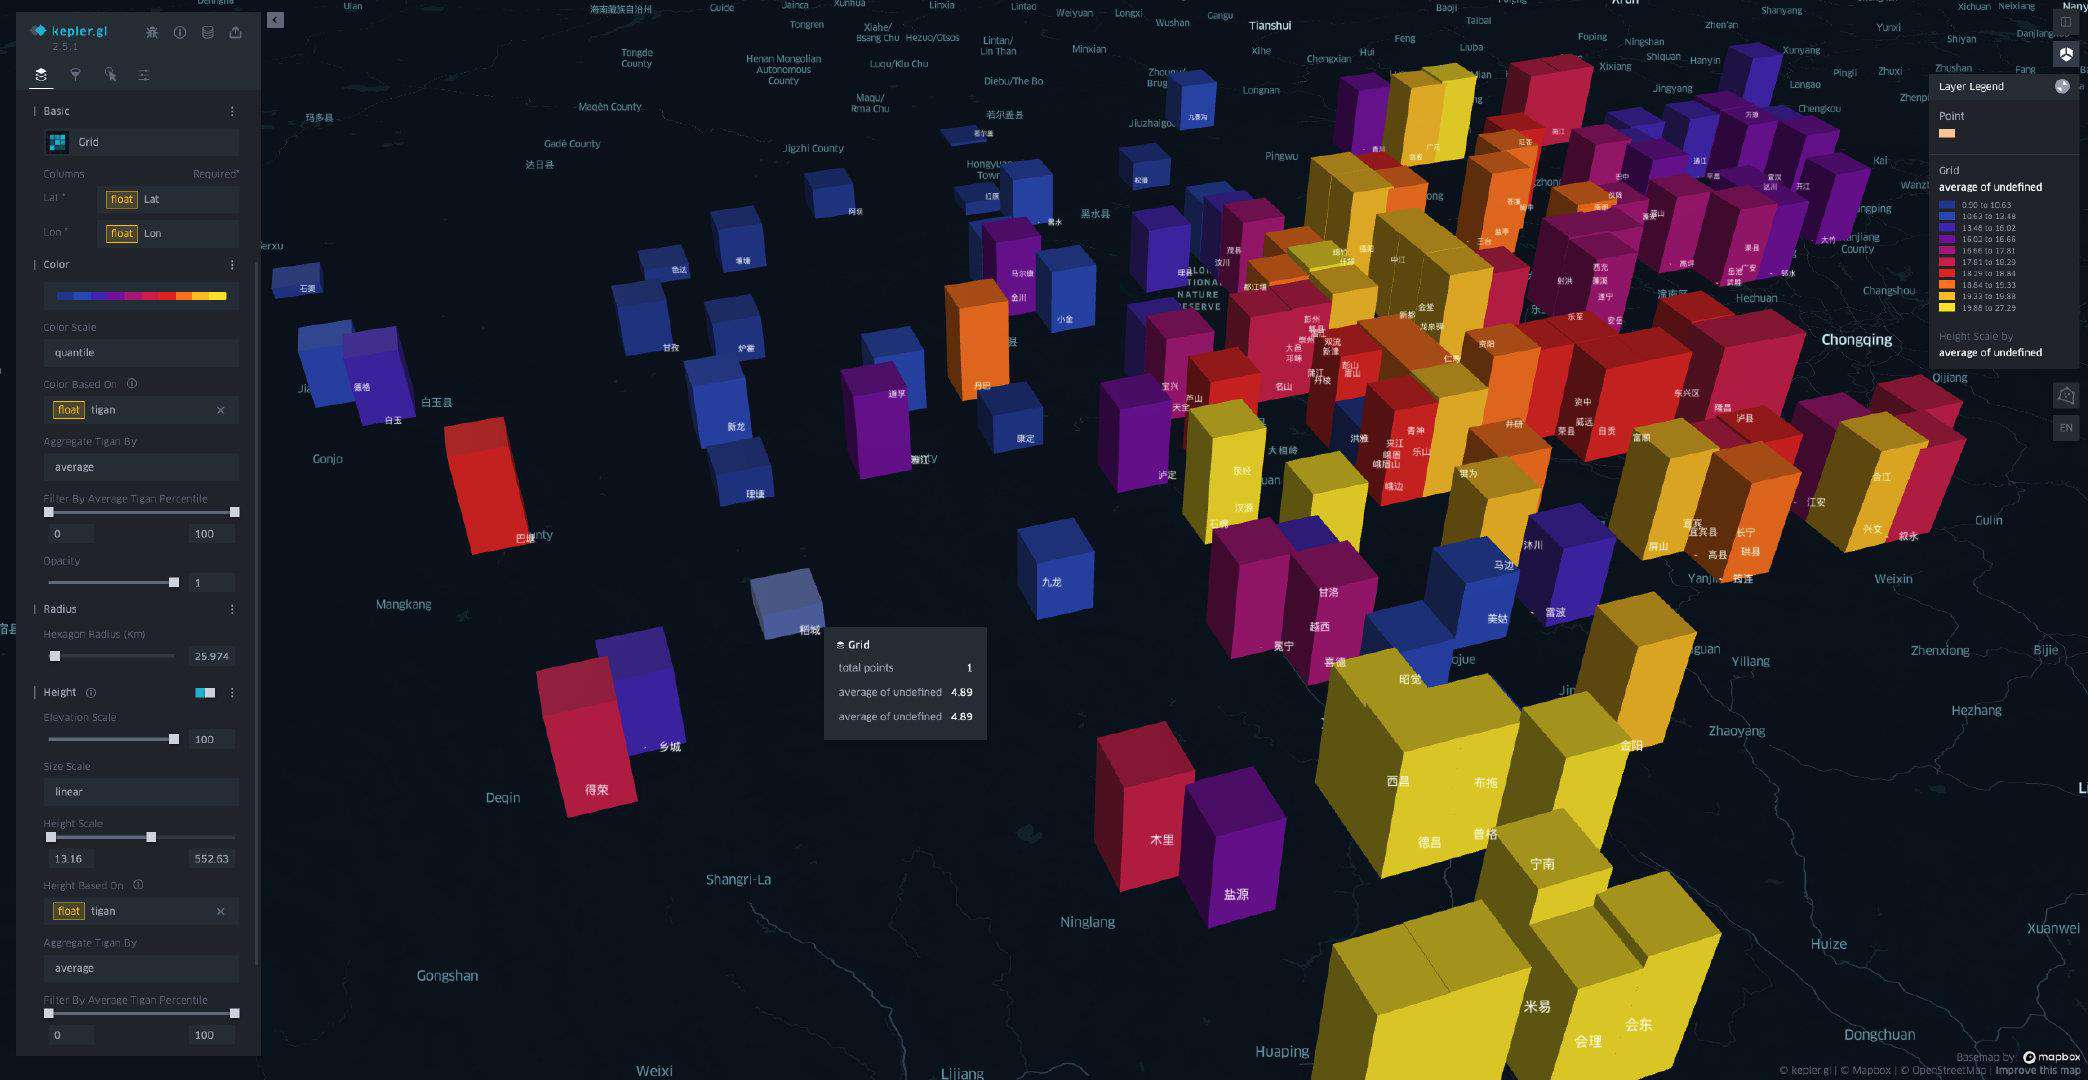
3.3.7 各气象站点体感温度三维视图
4. 写在后面
上面主要利用气象站点的气象数据并结合带有的经纬度的地理数据进行简单数据可视化分析查看,因点数据的局限性,没有尝试 kepler.gl 还支持的线、弧线、面、三维模型等可视化功能。如果对上面的功能感觉兴趣,可在官网查看更多炫酷的案例:
| Polygon - 海拔等高线 | Polygon - 区域人口 | Arc - 通勤起终点 | 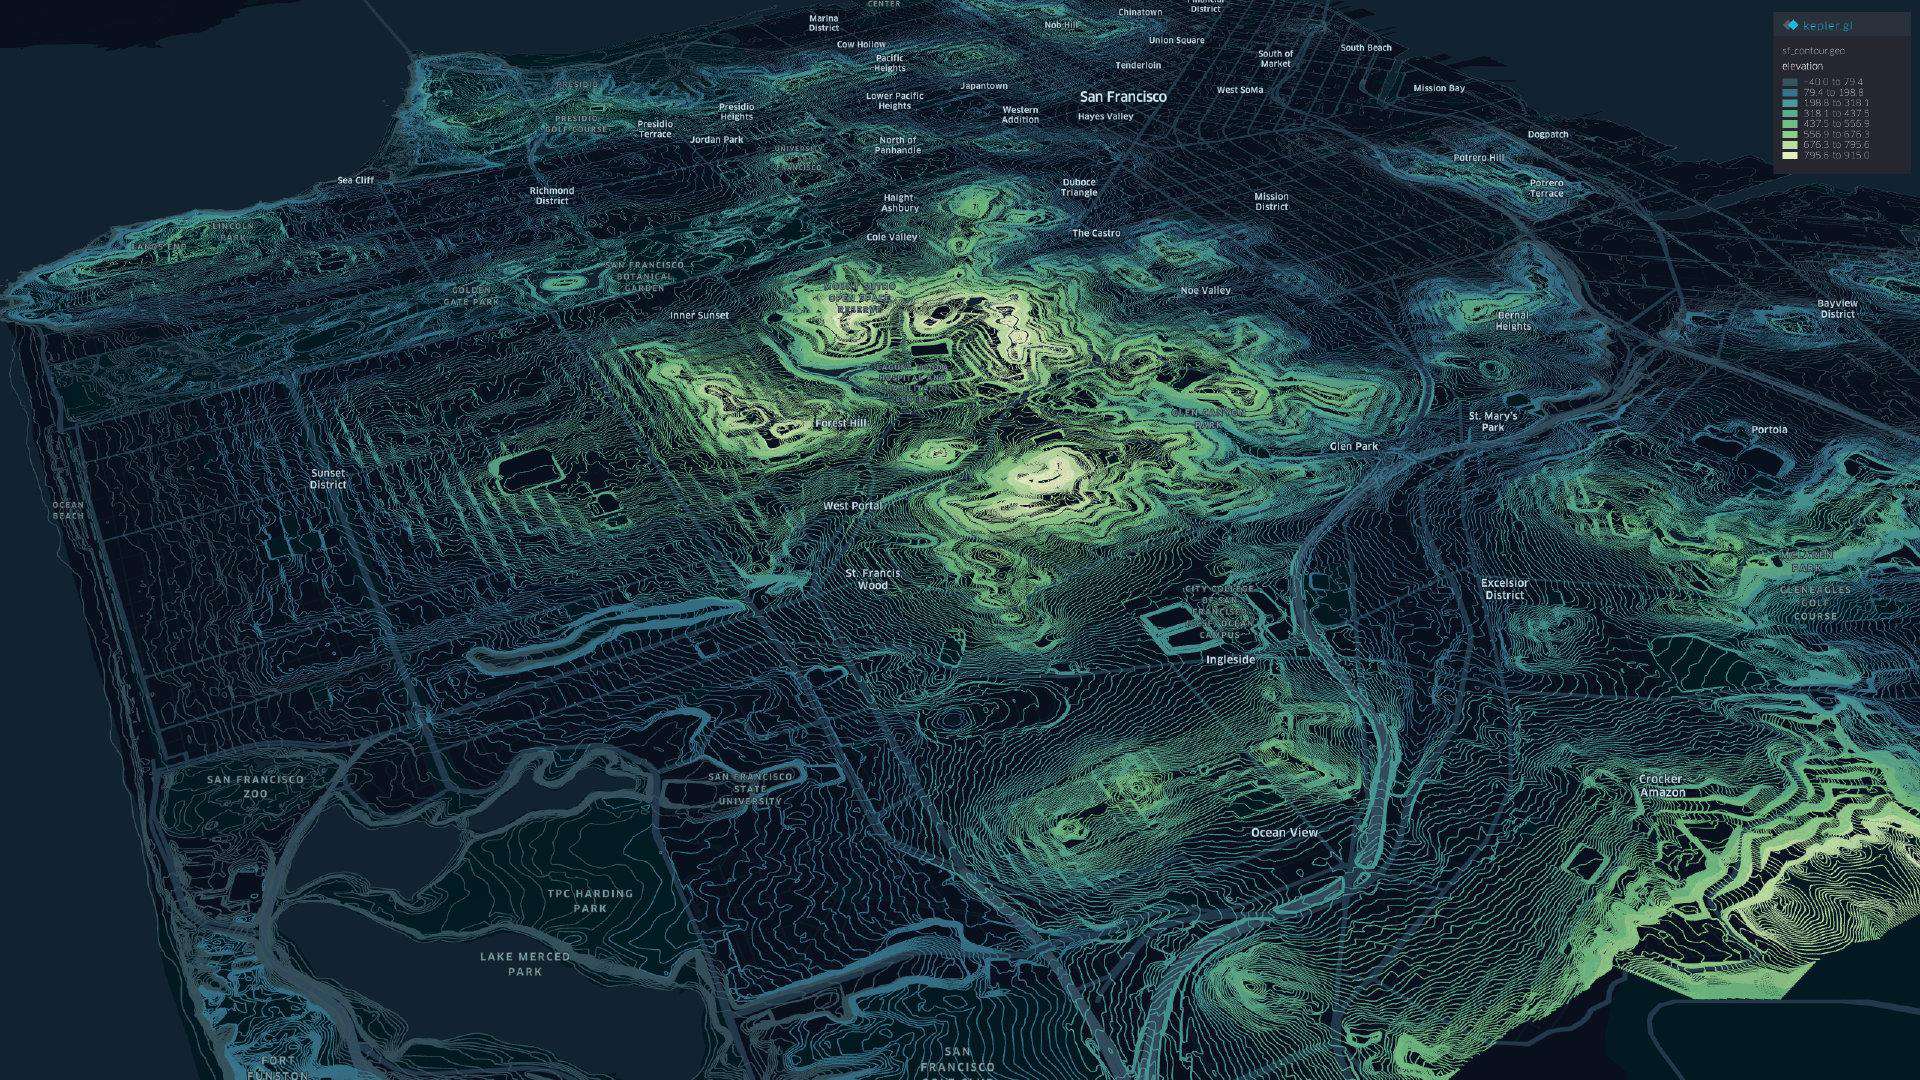 | 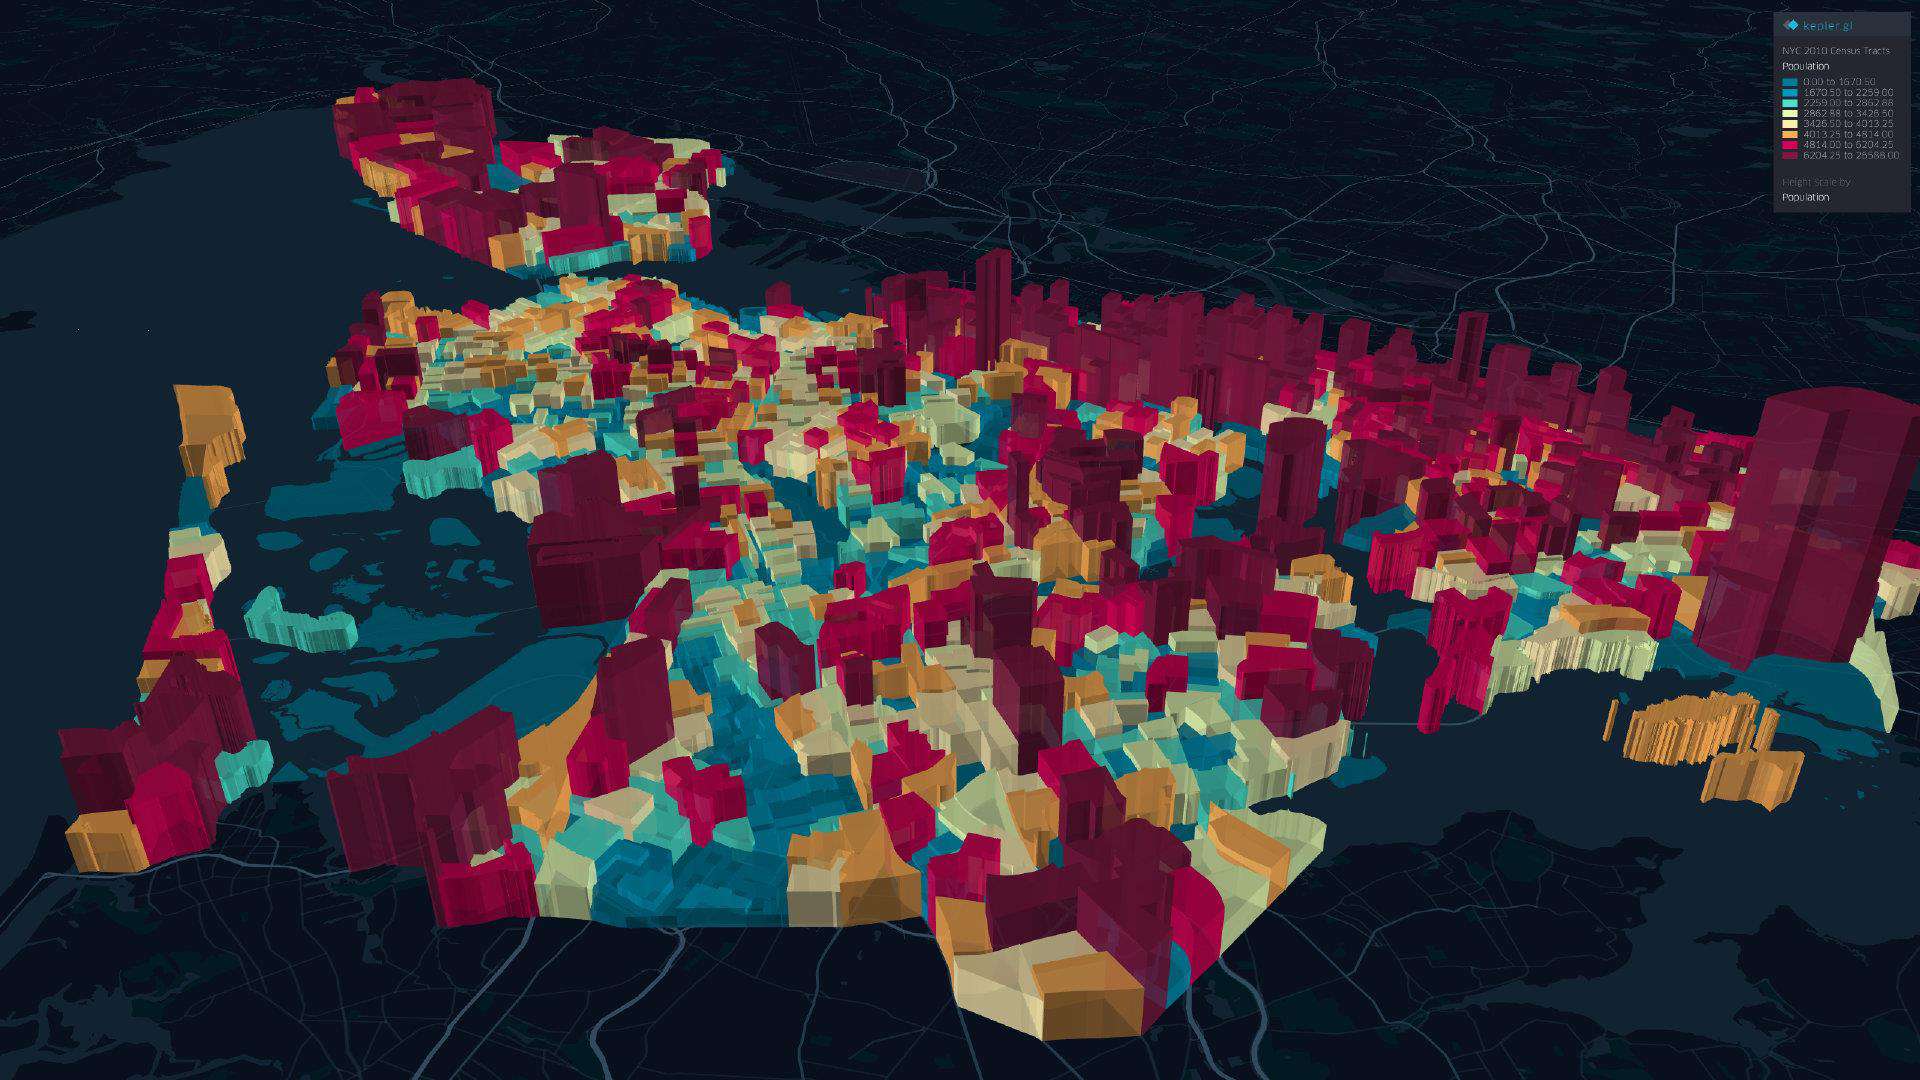 | 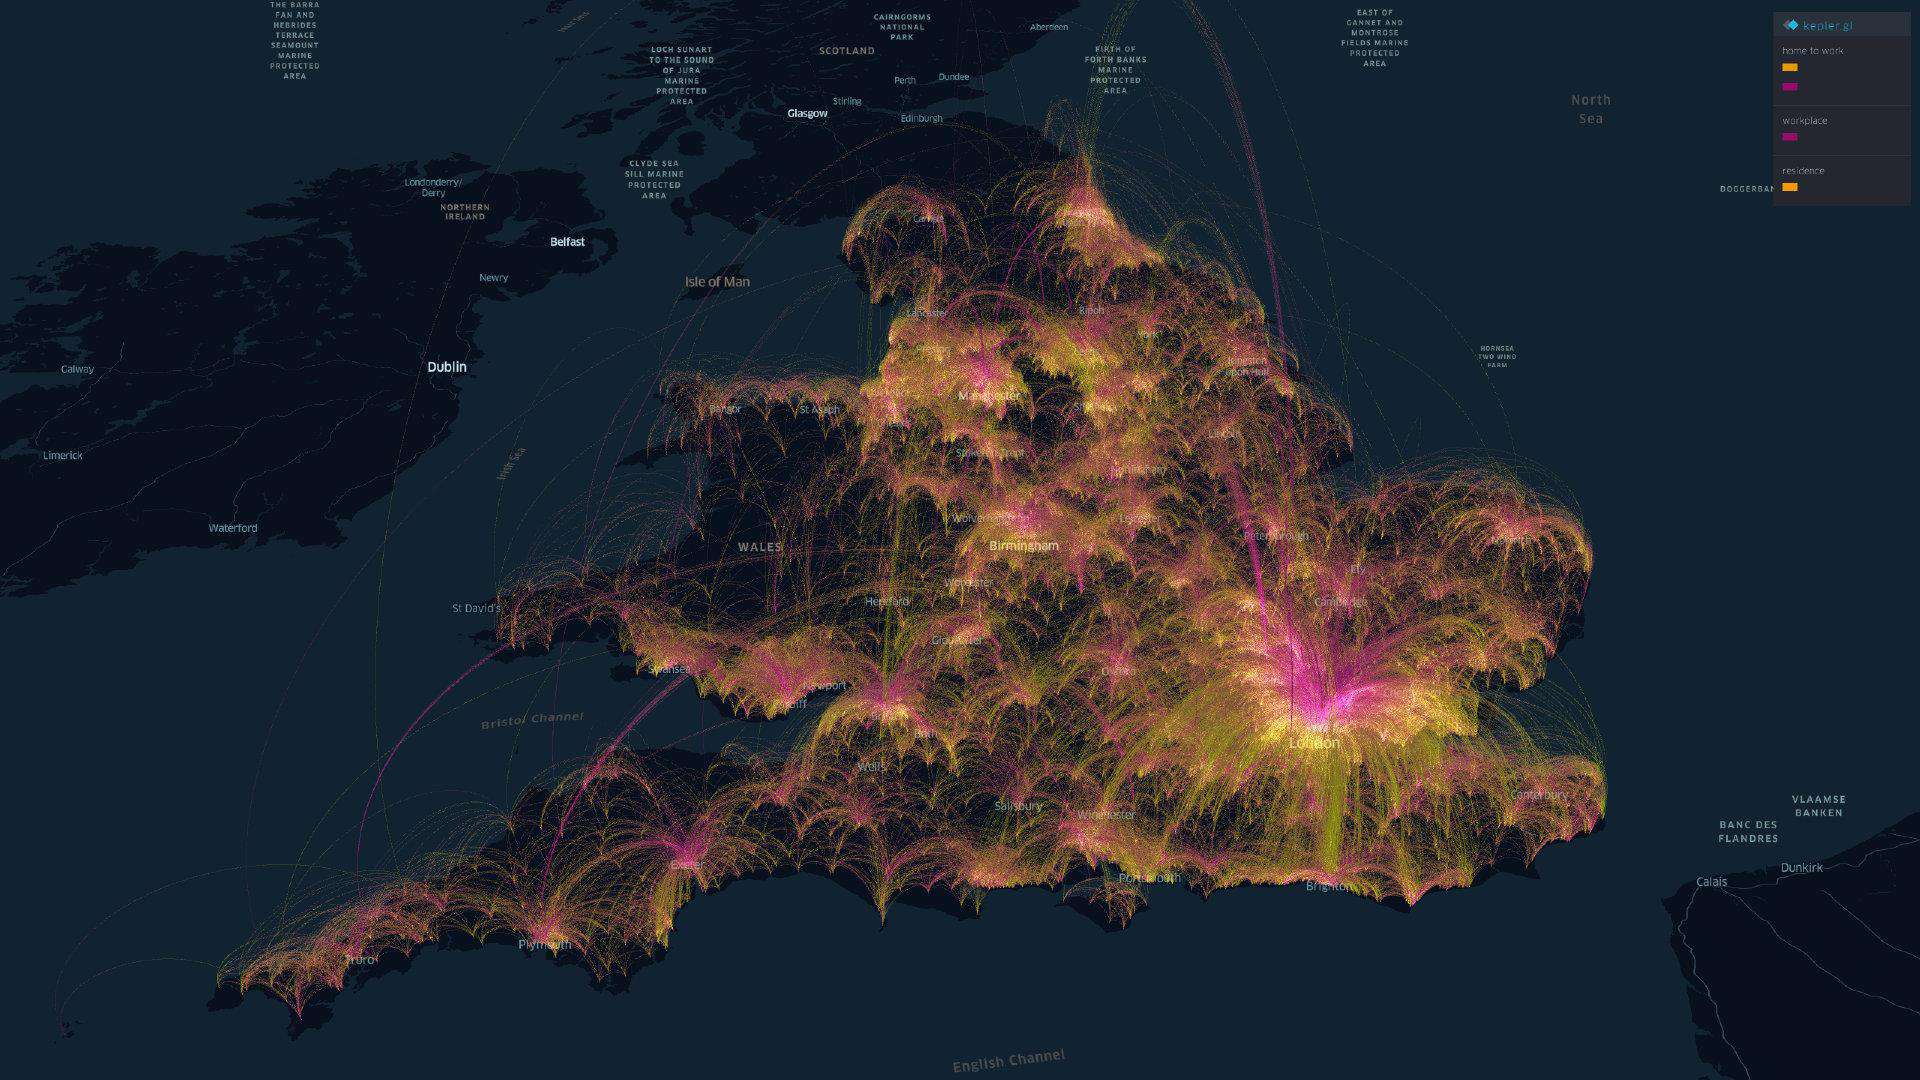 |
|---|
除此之外也有供比较详细的用户手册,对无编码经验的同学也能快速上手制作一份地理数据可视化解决方案。
参考资料
- kepler.gl api-reference
- Github Actions 部署前端项目
- vis-academy
- 中国气象科学数据中心
文中链接较多建议原文地址查阅。
常见问题FAQ
- 免费下载或者VIP会员专享资源能否直接商用?
- 本站所有资源版权均属于原作者所有,这里所提供资源均只能用于参考学习用,请勿直接商用。若由于商用引起版权纠纷,一切责任均由使用者承担。更多说明请参考 VIP介绍。
- 提示下载完但解压或打开不了?
- 找不到素材资源介绍文章里的示例图片?
- 模板不会安装或需要功能定制以及二次开发?


发表评论
还没有评论,快来抢沙发吧!