引入echarts
方法一: 在无webapck/ parcel情况下,CDN引入 直接在html引入``标签
<script src="https://cdn.bootcdn.net/ajax/libs/echarts/4.7.0/echarts.min.js"></script>
复制代码
然后使用全局变量window.echarts
方法二:有webpack/parcel情况下,命令行下载echarts
yarn add echarts
yarn add --dev @types/echarts  // 在TypeScript中运行
import echarts from 'echarts'或者`var echarts = require('echarts')`
复制代码
然后使用echarts即可
使用echarts
- 准备
DOM容器, 即echarts挂载的容器
<body>
    <!-- 为 ECharts 准备一个具备大小(宽高)的 DOM -->
    <div id="main" style="width: 600px;height:400px;"></div>
</body>
复制代码
- 添加
echarts代码
<!DOCTYPE html>
<html>
<head>
    <meta charset="utf-8">
    <title>ECharts</title>
    <!-- 引入 echarts.js -->
    <script src="echarts.min.js"></script>
</head>
<body>
    <!-- 为ECharts准备一个具备大小(宽高)的Dom -->
    <div id="main" style="width: 600px;height:400px;"></div>
    <script type="text/javascript">
        // 基于准备好的dom,初始化echarts实例
        var myChart = echarts.init(document.getElementById('main'));

        // 指定图表的配置项和数据
        var option = {
            title: {
                text: 'ECharts 入门示例'
            },
            tooltip: {},
            legend: {
                data:['销量']
            },
            xAxis: {
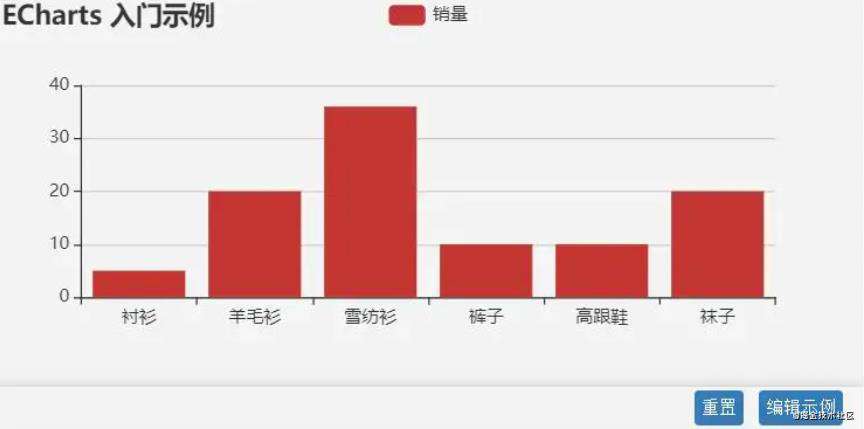
                data: ["衬衫","羊毛衫","雪纺衫","裤子","高跟鞋","袜子"]
            },
            yAxis: {},
            series: [{
                name: '销量',
                type: 'bar',
                data: [5, 20, 36, 10, 10, 20]
            }]
        };

        // 使用刚指定的配置项和数据显示图表。
        myChart.setOption(option);
    </script>
</body>
</html>
复制代码
- 效果图

更新主题
方法一:通过echarts.init()方法
const main = document.getElementById('main')
const myChart = eacharts.init(main, 'dark') // 第二次参数可以设置为light或者default
复制代码
方法二:细节修改
myChart.setOption({
    series:[{
    // 修改线条的填充颜色
        lienStyle:{
            color:blue
        },
    // 修改填充点宽带
       itemStyle:{
         borderWidth:10
       },
        name:'bug数',
        data:[820,935,901,934,1290,1330,1320],
        type:'line'
    }]
})
复制代码
更新echarts数据
使用setOption更新x坐标轴数据
- 使用
showLoading() / hideLoading() echarts会自动找出差异,并更新图表
// html
<button id="loadMore">加载更多</button>

// js
const loadMoreButton = document.getElementById('loadmore')
// echarts部分
loadMoreButton.addEventListener('click',()=>{
    const newKey = '2020-01-27'
    const newValue = 10
    myChart.setOption({
        xAxis:{
         data:[...prviousData, newKey] //整合新旧数据生成新的数据
        },
        series:[{
            data:[...value, newValue]  //整合新旧数据生
        }]
    })
})
复制代码
加载数据
使用showLoading()显示加载数据的动画, showLoading()关闭加载的动画
let isLoading = false
loadMoreButton.addEventListener('click',()=>{
   if(isLoading === true) {return}
    myChart.showLoading()
    isLoading = true
    setTimeout(()=>{
        const newKey = '2020-01-27'
        const newValue = 10
        myChart.setOption({
            xAxis:{
             data:[...prviousData, newKey] //整合新旧数据生成新的数据
            },
            series:[{
                data:[...value, newValue]  //整合新旧数据生
            }]
        })
        myChart.showLoading()
        isLoading= false
    }, 3000)
})
复制代码
点击事件
使用on监听事件
myChart.on('click',(e)=>{
    window.alert(`${e.name}`被点击了)
})
复制代码
移动端适配
常规技巧 meta淘宝手机版复制到项目的html中
<meta name="viewport" content="width=device-width,initial-scale=1,minimum-scale=1,maximum-scale=1,user-scalable=no,viewport-fit=cover">
复制代码
使用JS获取屏幕宽度设置在div上, 设计宽高比例
const width = document.documentElement.clientWidth
main.style.width = `${width}px`
main.style.height = `${width*1.2}px`
复制代码
同时适配移动端和PC端, 使用baseOption和media
myChart.setOption({
    baseOption:{
       // PC端自定义部分
    },
    meidia:[
    {
         // 移动端自定义部分
        query:{
           maxWidth:500
        },
        option:{
            series:[{
                // 省略代码
            }]
        }
        // 省略代码
    }
    ]
})
复制代码
echarts适配Vue
将echarts封装成组件
// 子组件 vue-echarts
<template>
    <div ref="container">

    </div>
</template>

<script>
import echart from 'echarts'
export default {
    props: ['option','loading']
    mounted(){
        const width = document.documentElement.clientWidth
        this.$refs.container.style.width = `${width}px`
        this.$refs.container.style.height = `${width * 1.2}px`
        this.chart = echarts.init(this.$refs.container,'dark')
        this.chart.setOption(this.option)
    },
    watch:{
        option(){
            this.chart.setOption(this.option)
        },
        loading(){
            if(loading){
                this.chart.showLoading()
            }else{
                this.chart.hideLoading()
            }
        }
    }
}
</script>
复制代码
// 父组件,包含echarts子组件
<template>
  <div>
      <h1>
          vue里使用echarts
      </h1>
      <vue-echarts :option="option" :loading="loading"></vue-echarts>
      <button @click="loadMore">加载更多</button>
  </div>
</template>

<script>
  import VueEcharts from './vue-echarts.vue'
  export default {
      mounted(){
        return {
            loading: false,
            option: {
                title: {
                    text: 'ECharts 入门示例'
                },
                tooltip: {},
                legend: {
                    data:['销量']
                },
                xAxis: {
                    data: ["衬衫","羊毛衫","雪纺衫","裤子","高跟鞋","袜子"]
                },
                yAxis: {},
                series: [{
                    name: '销量',
                    type: 'bar',
                    data: [5, 20, 36, 10, 10, 20]
                }]

        }
      }
    },
    component:{VueEcharts},
    methods:{
        loadMore(){
            this.loading = true
            setTimeout( ()=>{
            this.loading = false
            this.option = this.setOption({
                xAxis:{
                    data:[...prviousData, newKey] //整合新旧数据生成新的数据
                },
                series:[{
                    data:[...value, newValue]  //整合新旧数据生
                       }]
                })
            },3000)
        }
    }
  }
</script>
复制代码
echarts适配React
// 子组件 React-echarts
import React,{useState} from 'react'
import echarts from 'echarts'

export function ReactEcharts(props){
   const {option, loading} = props
   const container = useRef(null)
   const chart= useRef(null)
   useEffect(()=>{
     const width = document.documentElement.clientWidth
     container.current.style.width = `${width}px`
     container.current.style.height = `${width * 1.2}px`
     chart.current = echarts.init(container.current,'dark')
   },[])
   useEffect(()=>{
       chart.current.setOption(option)
   },[option])
   useEffect(()=>{
       if(loading){
           chart.current.showLoading()
       }else{
           chart.current.hideLoading()
       }
   },[loading])
    return(
        <div ref={container}></div>
        )
}
复制代码
// 父组件,包含echarts子组件
import React from 'react'
import {ReactEcharts} from './react-echarts'

function ReactEcharts(){
    const [loading, setLoading] = useState(false)
    const [option, setOption] = useState({
         title: {
                text: 'ECharts 入门示例'
            },
            tooltip: {},
            legend: {
                data:['销量']
            },
            xAxis: {
                data: ["衬衫","羊毛衫","雪纺衫","裤子","高跟鞋","袜子"]
            },
            yAxis: {},
            series: [{
                name: '销量',
                type: 'bar',
                data: [5, 20, 36, 10, 10, 20]
            }]
    })

    const onClick =()=>{
        if(loading){return}
        setLoading(true)
        setTimeout(()=>{
            setLoading(false)
            setOption({
               xAxis:{
                    data:[...prviousData, newKey] //整合新旧数据生成新的数据
                },
               series:[{
                    data:[...value, newValue]  //整合新旧数据生
                       }]
           })
        },3000)
    }

    return(
      <div>
        <h1>在React里使用Echarts</h1>
        <ReactEcharts option={option} loading={loading}/>
        <button onClick={onClick}></button>
      </div>
  )
}
复制代码
更多资料
常见问题FAQ
- 免费下载或者VIP会员专享资源能否直接商用?
- 本站所有资源版权均属于原作者所有,这里所提供资源均只能用于参考学习用,请勿直接商用。若由于商用引起版权纠纷,一切责任均由使用者承担。更多说明请参考 VIP介绍。
- 提示下载完但解压或打开不了?
- 找不到素材资源介绍文章里的示例图片?
- 模板不会安装或需要功能定制以及二次开发?


发表评论
还没有评论,快来抢沙发吧!