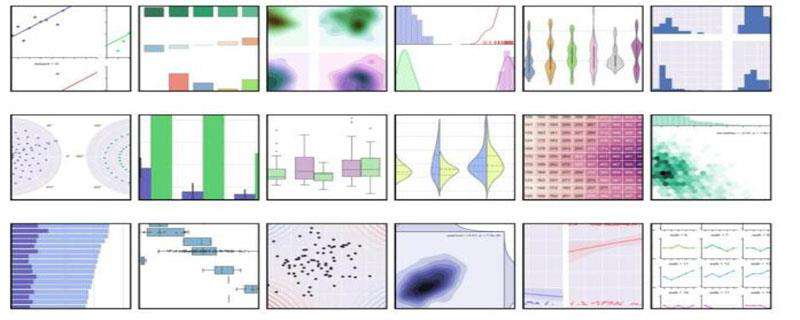
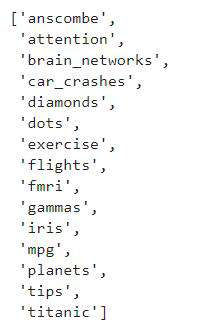
内置示例数据集
seaborn内置了十几个示例数据集,通过load_dataset函数可以调用。
其中包括常见的泰坦尼克、鸢尾花等经典数据集。
# 查看数据集种类
import seaborn as sns
sns.get_dataset_names()

import seaborn as sns
# 导出鸢尾花数据集
data = sns.load_dataset('iris')
data.head()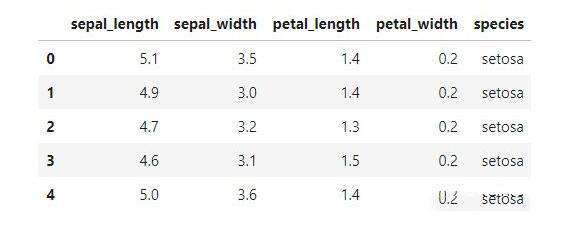
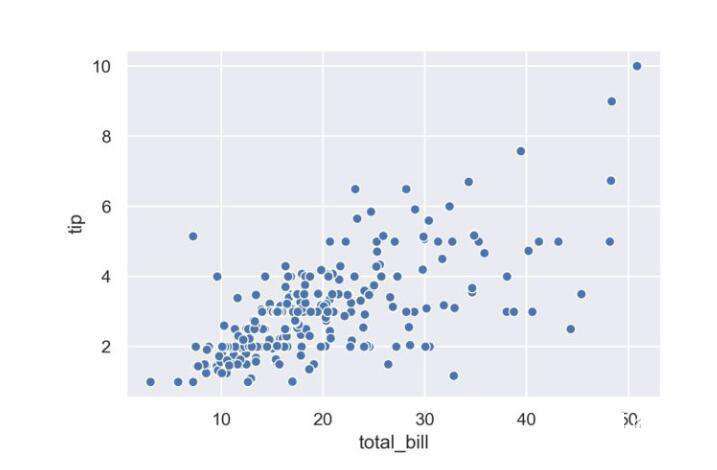
1、散点图
函数sns.scatterplot
import seaborn as sns
sns.set()
import matplotlib.pyplot as plt
%matplotlib inline
# 小费数据集
tips = sns.load_dataset('tips')
ax = sns.scatterplot(x='total_bill',y='tip',data=tips)
plt.show()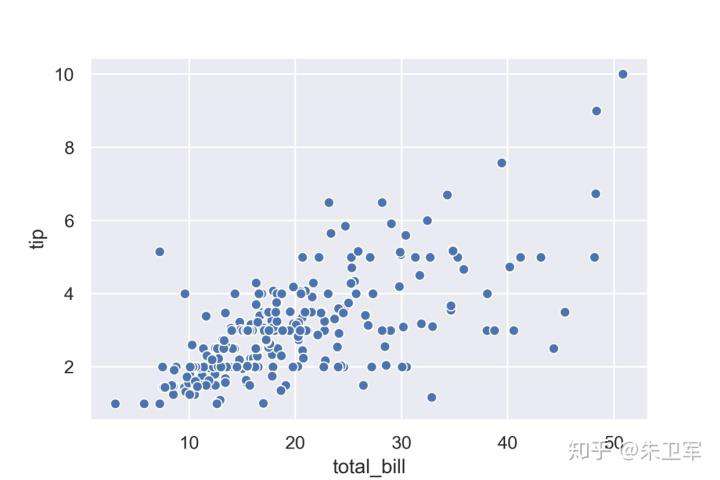
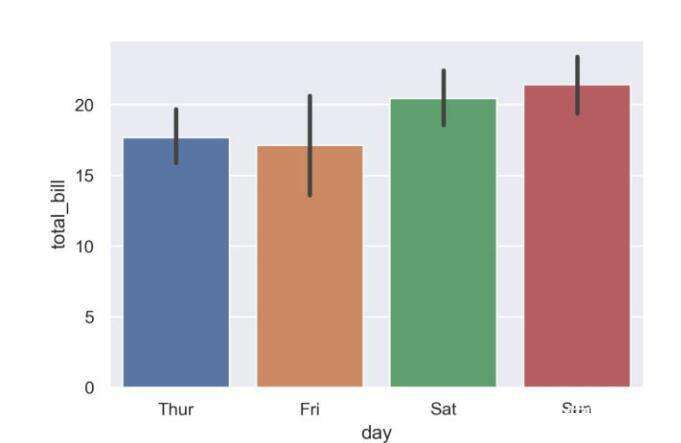
2、条形图
函数sns.barplot
显示数据平均值和置信区间
import seaborn as sns
sns.set()
import matplotlib.pyplot as plt
%matplotlib inline
# 小费数据集t
ips = sns.load_dataset("tips")
ax = sns.barplot(x="day", y="total_bill", data=tips)
plt.show()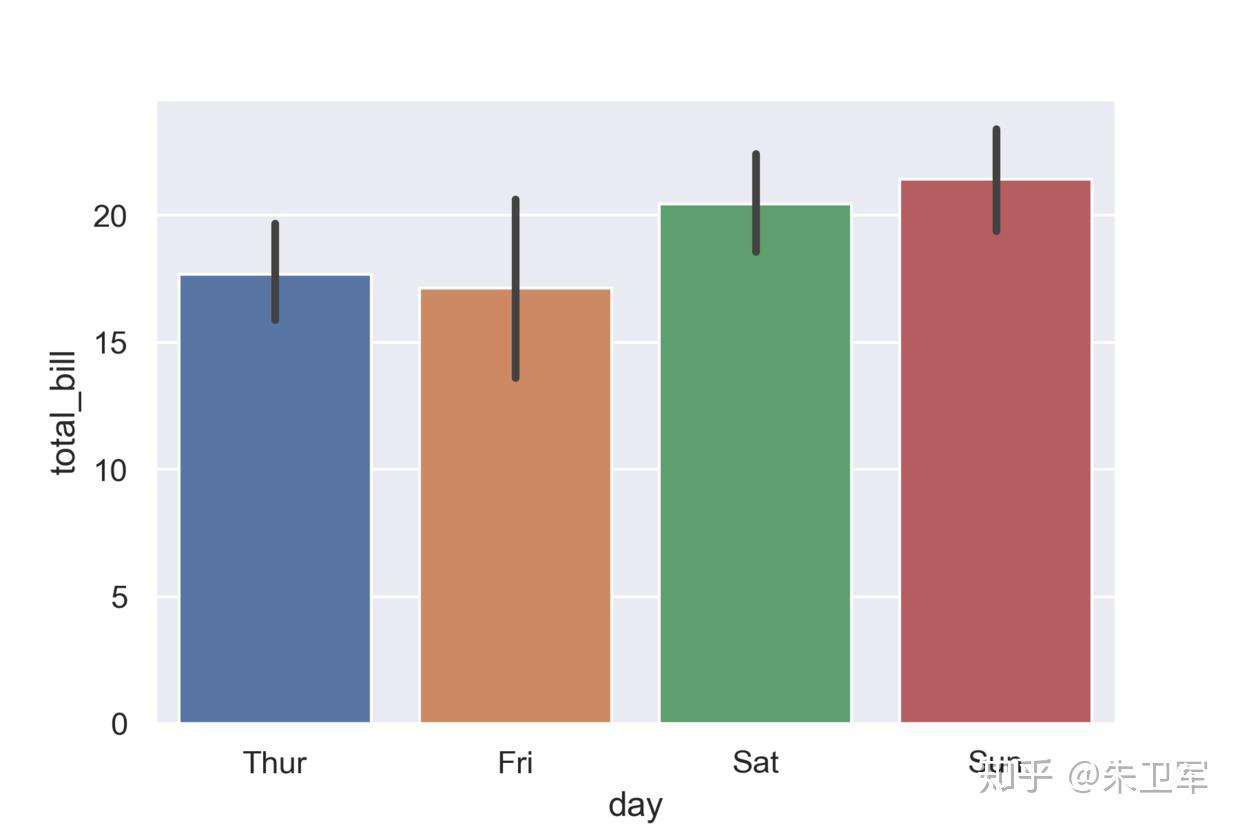
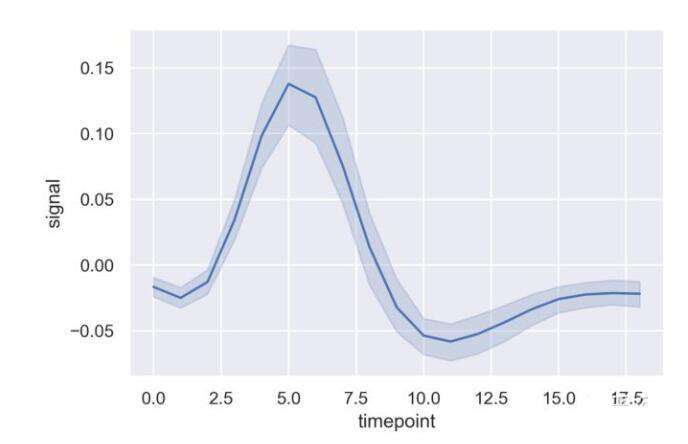
3、线型图
函数sns.lineplot
绘制折线图和置信区间
import seaborn as sns
sns.set()
import matplotlib.pyplot as plt
%matplotlib inline
fmri = sns.load_dataset("fmri")
ax = sns.lineplot(x="timepoint", y="signal", data=fmri)
plt.show()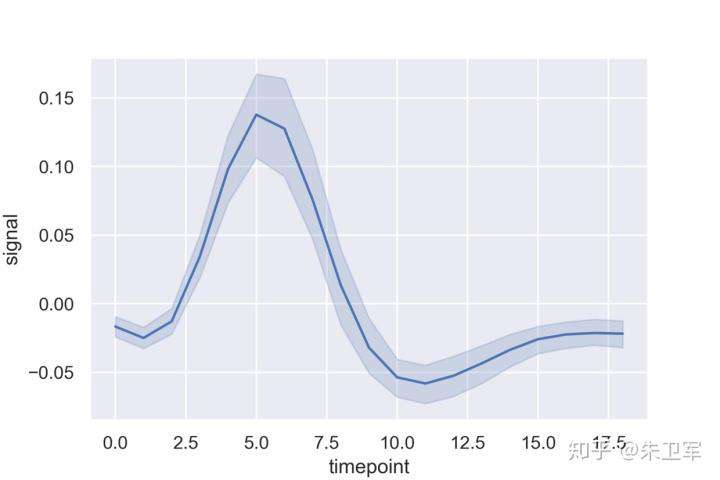
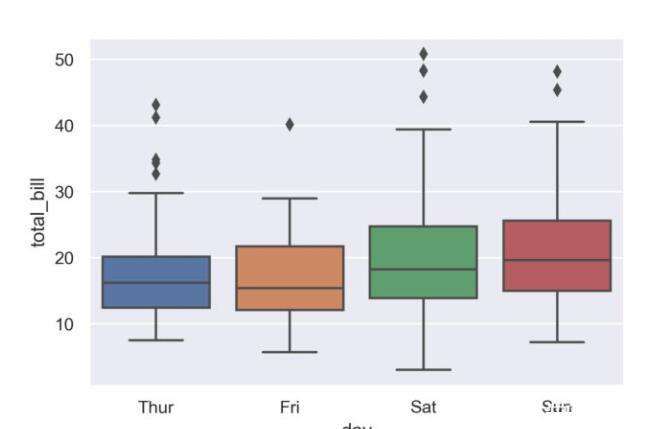
4、箱线图
函数seaborn.boxplot
import seaborn as sns
sns.set()
import matplotlib.pyplot as plt
%matplotlib inline
tips = sns.load_dataset("tips")
ax = sns.boxplot(x="day", y="total_bill", data=tips)
plt.show()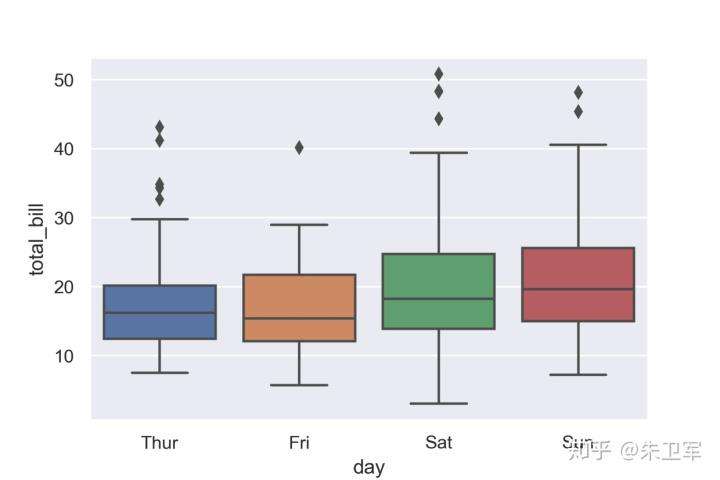
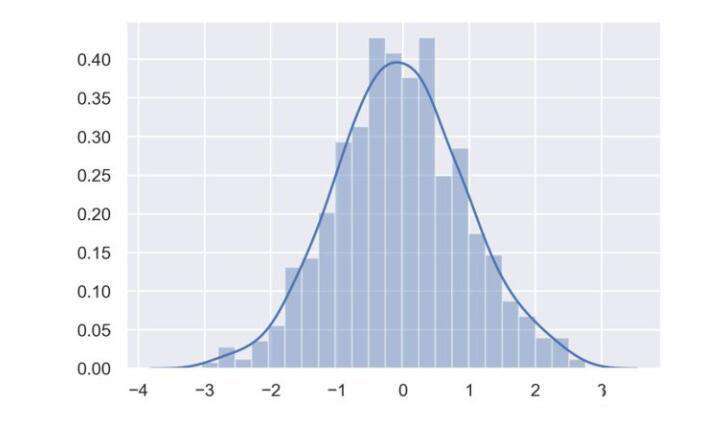
5、直方图
函数seaborn.distplot
import seaborn as sns
import numpy as np
sns.set()
import matplotlib.pyplot as plt
%matplotlib inline
np.random.seed(0)
x = np.random.randn(1000)
ax = sns.distplot(x)
plt.show()
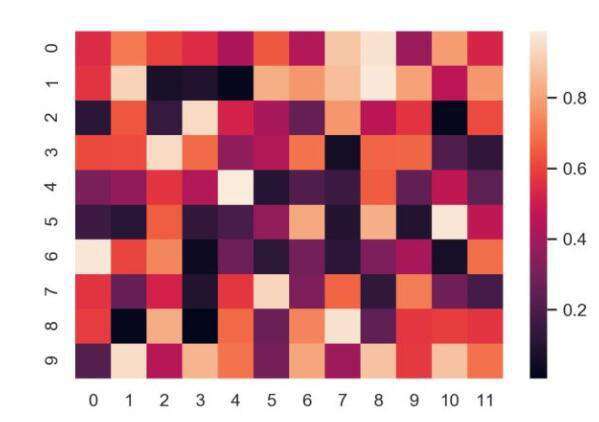
6、热力图
函数seaborn.heatmap
import numpy as np
np.random.seed(0)
import seaborn as sns
sns.set()
import matplotlib.pyplot as plt
%matplotlib inline
uniform_data = np.random.rand(10, 12)
ax = sns.heatmap(uniform_data)
plt.show()
7、散点图矩阵
函数sns.pairplot
import seaborn as sns
sns.set()
import matplotlib.pyplot as plt
%matplotlib inline
iris = sns.load_dataset("iris")
ax = sns.pairplot(iris)
plt.show()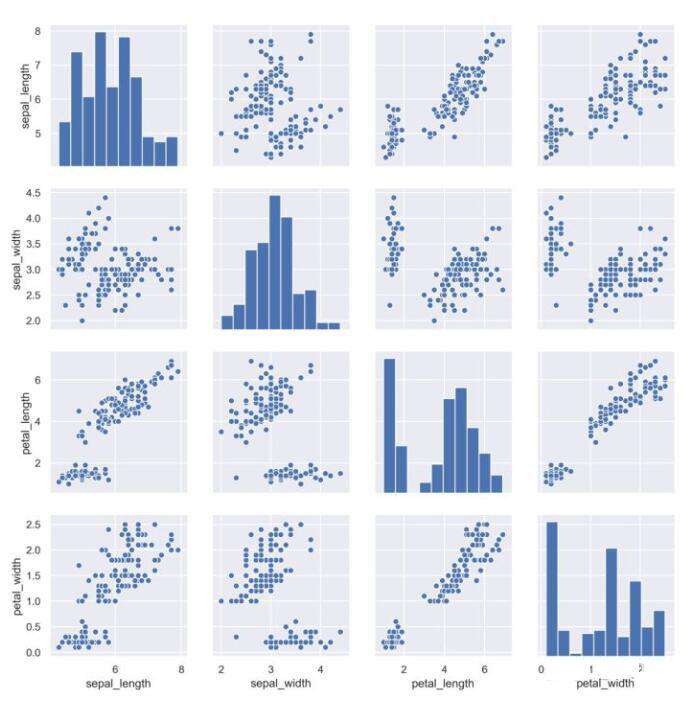
8、分类散点图
函数seaborn.catplot
import seaborn as sns
sns.set()
import matplotlib.pyplot as plt
%matplotlib inline
exercise = sns.load_dataset("exercise")
ax = sns.catplot(x="time", y="pulse", hue="kind", data=exercise)\
plt.show()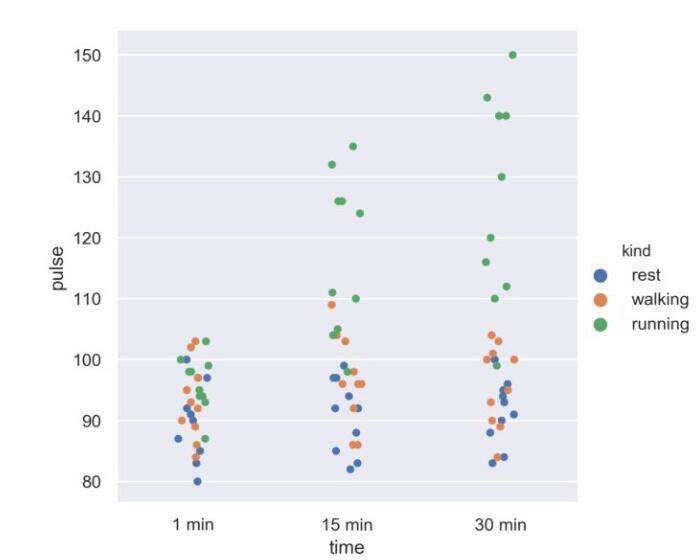
9、计数条形图
函数seaborn.countplot
import seaborn as sns
sns.set()
import matplotlib.pyplot as plt
%matplotlib inline
titanic = sns.load_dataset("titanic")
ax = sns.countplot(x="class", data=titanic)
plt.show()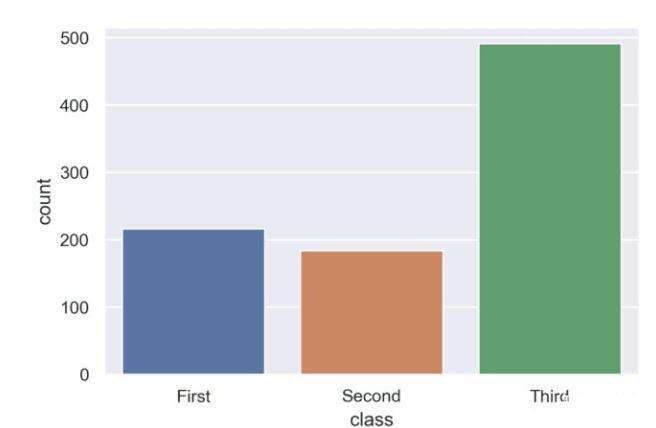
10、回归图
函数 seaborn.lmplot
绘制散点及回归图
import seaborn as sns
sns.set()
import matplotlib.pyplot as plt
%matplotlib inline
tips = sns.load_dataset("tips")
ax = sns.lmplot(x="total_bill", y="tip", data=tips)
plt.show()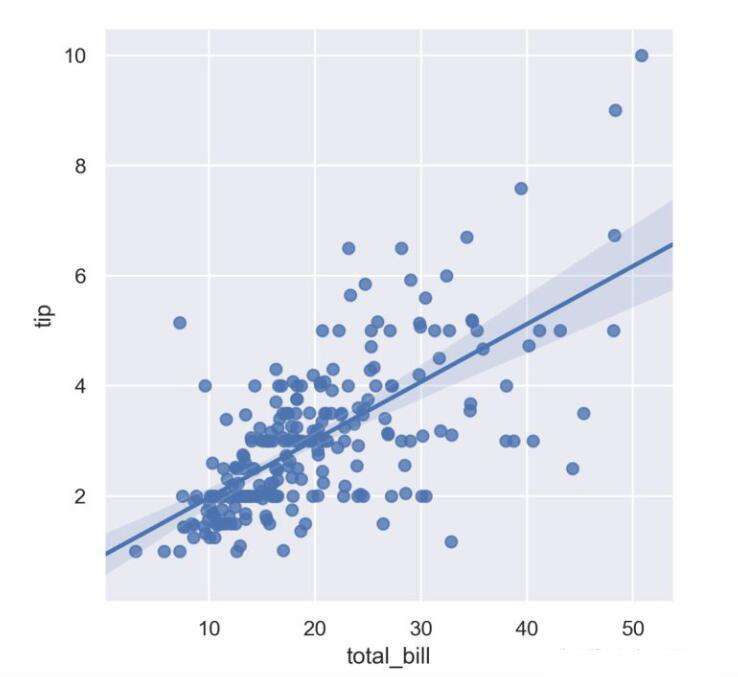
常见问题FAQ
- 免费下载或者VIP会员专享资源能否直接商用?
- 本站所有资源版权均属于原作者所有,这里所提供资源均只能用于参考学习用,请勿直接商用。若由于商用引起版权纠纷,一切责任均由使用者承担。更多说明请参考 VIP介绍。
- 提示下载完但解压或打开不了?
- 找不到素材资源介绍文章里的示例图片?
- 模板不会安装或需要功能定制以及二次开发?


发表评论
还没有评论,快来抢沙发吧!